

Microbial Quality of Drinking Water and Prevalence of Water-Related Diseases in Marigat Urban Centre, Kenya
- PMID: 30899150
- PMCID: PMC6419249
- DOI: 10.1177/1178630219836988
Microbial Quality of Drinking Water and Prevalence of Water-Related Diseases in Marigat Urban Centre, Kenya
Abstract
Background: Accessibility to potable water is a fundamental right for dignity and well-being. Despite this observation, more than 1.1 billion people lack access to safe drinking water. This is particularly true in the Sub-Saharan Africa and South East Asia regions.
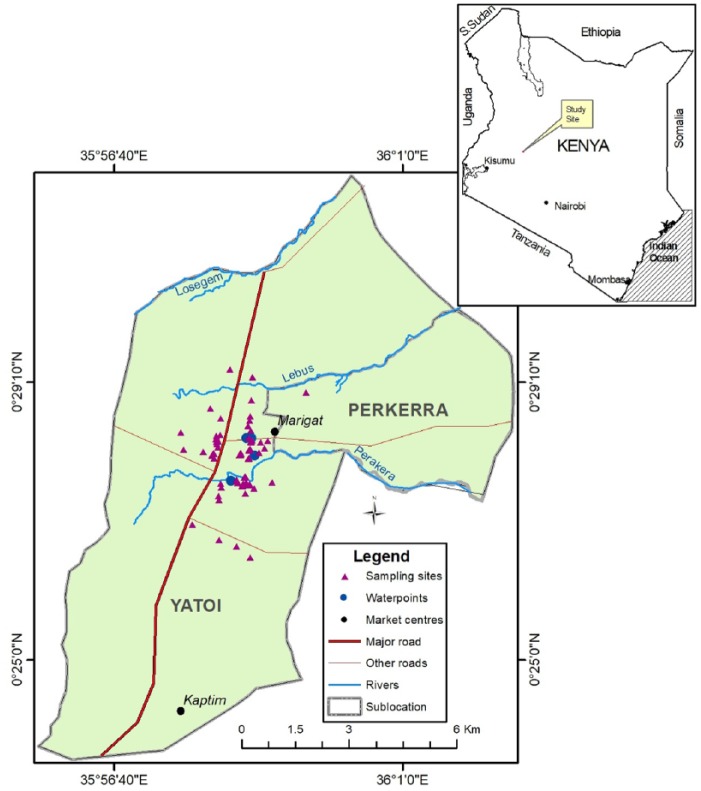
Objective: The main aim of this study was to assess microbial quality of drinking water and prevalence of water-related diseases in Marigat town, Baringo County, Kenya.
Methods: Samples of drinking water were collected from water sources (boreholes, rivers, and wells) and at the point of use (households) and analyzed for Escherichia coli and total coliform (TC) bacteria using the most probable number method. In situ measurements of pH and temperature were performed using a Wagtech International portable meter. Clinical health records from the local health centers were also reviewed to assess the prevalence rates of some of the water-related diseases.
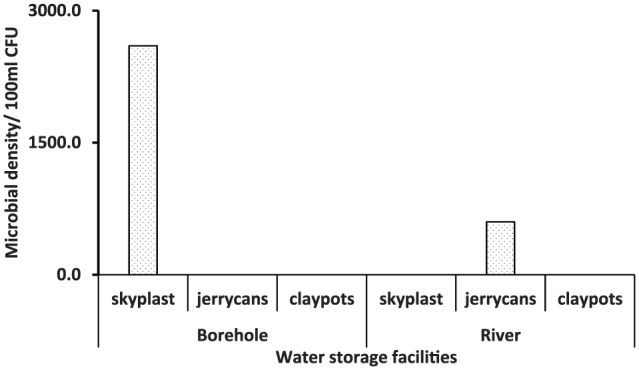
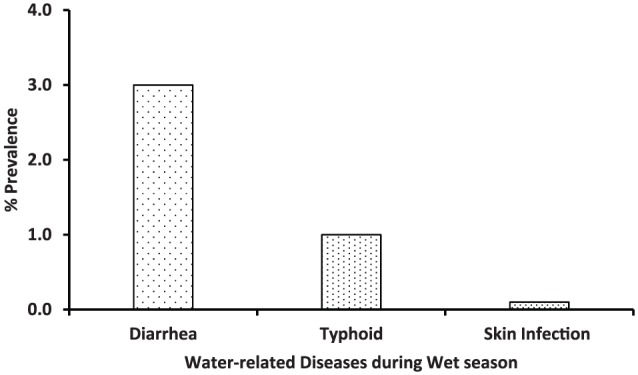
Results: There were significant differences among water sources during dry season for E coli (F2,21 = 3.629, P < .05) and TC (F2,21 = 4.041, P < .05). Similar observations were made during wet season for E coli (F2,21 = 4.090, P < .05) and TC (F2,21 = 1.893, P < .05). Furthermore, there were significant interactions between the water sources and season for E coli (F2,42 = 7.66, P < .01) and TC (F2,42 = 5.494, P < .05). Drinking water in large plastic storage containers (herein referred to as sky-plast) had the highest E coli and TC concentrations. Typhoid was the most prevalent water-related disease during the dry season (10%), whereas diarrhea (3%) was the most prevalent during the wet season.
Conclusions and recommendations: All drinking water at abstraction and point of use for Marigat residents are microbiologically contaminated and therefore pose serious health risks to consumers of such water. Thus, there is need for public health awareness campaigns on household water management to curb incidences of water-related diseases. Public health practitioners at county and national levels need to ensure that households have adequate access to potable water and improved sanitation.
Keywords: Borehole; microbial water quality; prevalence; water-related diseases.
Conflict of interest statement
Declaration of conflicting interests:The author(s) declared no potential conflicts of interest with respect to the research, authorship, and/or publication of this article.
Figures


Similar articles
-
Microbiological quality of water in a city with persistent and recurrent waterborne diseases under tropical sub-rural conditions: The case of Kikwit City, Democratic Republic of the Congo.Int J Hyg Environ Health. 2017 Jul;220(5):820-828. doi: 10.1016/j.ijheh.2017.03.011. Epub 2017 Mar 30. Int J Hyg Environ Health. 2017. PMID: 28416464
-
High levels of faecal contamination in drinking groundwater and recreational water due to poor sanitation, in the sub-rural neighbourhoods of Kinshasa, Democratic Republic of the Congo.Int J Hyg Environ Health. 2018 Apr;221(3):400-408. doi: 10.1016/j.ijheh.2018.01.003. Epub 2018 Jan 10. Int J Hyg Environ Health. 2018. PMID: 29396027
-
Sources and seasonal variation of coliform bacteria abundance in groundwater around the slopes of Mount Meru, Arusha, Tanzania.Environ Monit Assess. 2016 Jul;188(7):395. doi: 10.1007/s10661-016-5384-2. Epub 2016 Jun 7. Environ Monit Assess. 2016. PMID: 27270483
-
Microbial Water Quality at the Point of Use: The Role of Socio-Economic Factors and Water Handling Practices in Kitwe District, Zambia.Environ Health Insights. 2025 May 18;19:11786302251337563. doi: 10.1177/11786302251337563. eCollection 2025. Environ Health Insights. 2025. PMID: 40391106 Free PMC article. Review.
-
Sources, pathways, and relative risks of contaminants in surface water and groundwater: a perspective prepared for the Walkerton inquiry.J Toxicol Environ Health A. 2002 Jan 11;65(1):1-142. doi: 10.1080/152873902753338572. J Toxicol Environ Health A. 2002. PMID: 11809004 Review.
Cited by
-
Utilization of microalgae for agricultural runoff remediation and sustainable biofuel production through an integrated biorefinery approach.Bioresour Bioprocess. 2024 Jan 11;11(1):8. doi: 10.1186/s40643-023-00720-w. Bioresour Bioprocess. 2024. PMID: 38647842 Free PMC article.
-
How Sociodemographic, Water, and Sanitation Factors Influence Diarrhea in Children Under Five: Insights from Indonesia's Underdeveloped Regions.J Res Health Sci. 2025 Jan 1;25(1):e00636. doi: 10.34172/jrhs.2025.171. Epub 2024 Dec 25. J Res Health Sci. 2025. PMID: 39996345 Free PMC article.
-
Integrated Electrochemical Biosensors for Detection of Waterborne Pathogens in Low-Resource Settings.Biosensors (Basel). 2020 Apr 13;10(4):36. doi: 10.3390/bios10040036. Biosensors (Basel). 2020. PMID: 32294961 Free PMC article. Review.
-
Seasonal Variations in Household Water Use, Microbiological Water Quality, and Challenges to the Provision of Adequate Drinking Water: A Case of Peri-urban and Informal Settlements of Hosanna Town, Southern Ethiopia.Environ Health Insights. 2024 Mar 21;18:11786302241238940. doi: 10.1177/11786302241238940. eCollection 2024. Environ Health Insights. 2024. PMID: 38525297 Free PMC article.
-
Ceramic Filters Coated with Green Ag-Nanoparticles for Drinking Water Treatment in Rural Households of Nigeria.Environ Health Insights. 2024 Sep 26;18:11786302241282997. doi: 10.1177/11786302241282997. eCollection 2024. Environ Health Insights. 2024. PMID: 39359343 Free PMC article.
References
-
- World Bank. World Development Indicators 2015. Washington, DC: World Bank Publications; 2015.
-
- World Health Organization (WHO). Global Report on Drowning: Preventing a Leading Killer. Geneva, Switzerland: WHO; 2014.
-
- World Health Organization (WHO). Drinking water fact sheets. www.who.int/mediacentre/factsheets/fs391/en/.Up-dated2017. Accessed July 2017.
-
- Vaziri M, Tolouei R. Urban water resources sustainable development: a global comparative appraisal. Iran J Sci Technol. 2010. 34::93–106.
-
- Futi A, Otieno WS, Acholla OJ, Otieno WA, Ochieng OS, Mukisira MC. Harvesting surface rainwater purification using Moringa oleifera seed extracts and aluminium sulfate. Kenya J Agric Ext Rural Dev. 2011. 3::102–112.
LinkOut - more resources
Full Text Sources
Miscellaneous
