. 2019 Feb 15;11(2):542-556.
eCollection 2019.

Biomechanical analysis of the effect of medial meniscus degenerative and traumatic lesions on the knee joint

Affiliations

Biomechanical analysis of the effect of medial meniscus degenerative and traumatic lesions on the knee joint

Lan Li et al. Am J Transl Res. .

Abstract

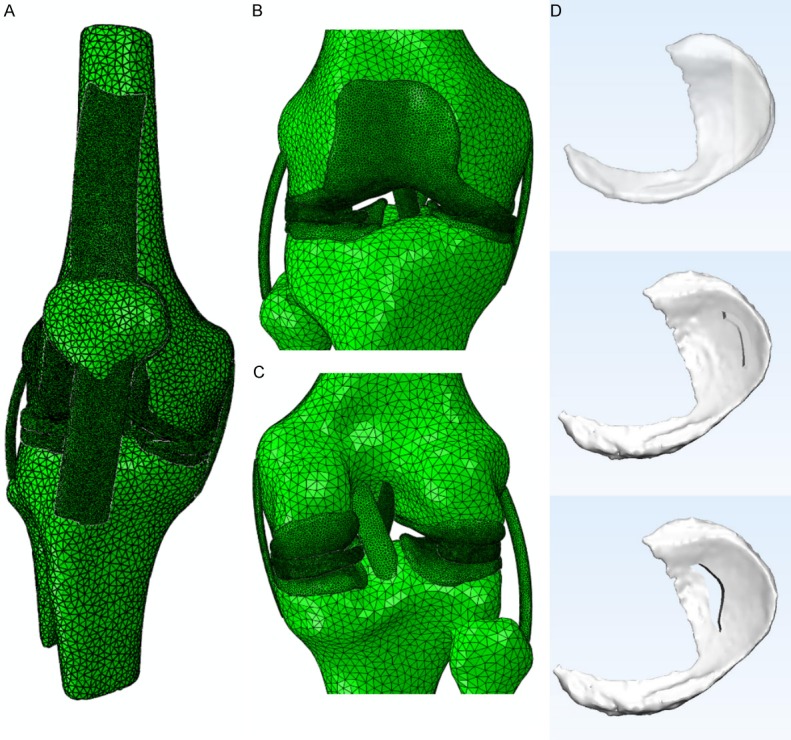
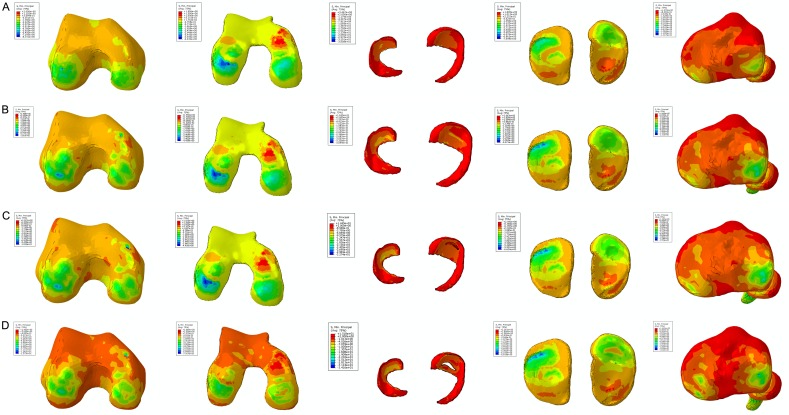
The purpose of this study was to determine the effect of the degenerative medial meniscus and traumatic lesions on the biomechanical behavior of the knee. An elaborate three-dimensional (3D) finite element model of the total knee joint containing bones, articular cartilages, main ligaments, and menisci was developed from a combination of magnetic resonance images and computed tomography. Three types of meniscus tears were employed to represent the degenerative and traumatic lesions. The stress and meniscus extrusion of healthy and injured knees were investigated under the posture of static stance. The traumatic longitudinal tear demonstrated the highest stress and the largest meniscus extrusion displacement. The degenerative horizontal and peripheral tears also showed an irregular biomechanical balance in the knee joint. Despite the damaged hemijoint, the stress on the healthy lateral hemijoint was increased. Although the biomechanics was deteriorated in all meniscus tear models, the variation degree was diverse. The transfixion damage could potentially cause future injury in the knee joint and accelerate the progress of osteoarthritis. Moreover, the meniscus injury may cause high-stress concentration on the contralateral side of the joint. The current results revealed the cause of different clinical manifestation after meniscus tears and the risk of knee osteoarthritis through biomechanical aspects.

Keywords: Meniscus tear; biomechanics; finite element simulation; knee joint; osteoarthritis.


Conflict of interest statement

None.

Figures

Figure 1
Figure 1
The view of 3D models used in the FE simulation. The general view of knee joint model showed in Abaqus 2017 (A), the frontal partial enlargement view of the knee joint showed in Abaqus 2017 (B), and the rear partial enlargement view of the knee joint showed in Abaqus 2017 (C). The 3D meniscus tear models made by Magics 19.0 and showed in 3-matic 11.0 (D), from top to bottom was a horizontal tear, peripheral tear, and longitudinal tear, respectively.
Figure 2
Figure 2
The maximum compression stress and shear stress applied on the knee joint in the static stance simulation. The maximum compression stress in the medial hemijoint (A), the stress on the femur and tibia increased obviously after meniscus tears. The maximum compression stress in the lateral hemijoint (B), the stress on the tibia increased obviously after meniscus tears. The maximum shear stress in the medial hemijoint (C), the stress on the femur, meniscus, and tibia increased obviously after meniscus tears, and the highest value appeared on the longitudinal tear. The maximum shear stress in the lateral hemijoint (D), the stress on the femur increased after meniscus tears, and the highest value appeared on the longitudinal tear.
Figure 3
Figure 3
The results of the compression stress (Min Principal stress) in the static stance simulation. The color change from deep blue to orange represented the stress variation from large to small on the stress nephogram. The same threshold was applied for the same region. The lateral and medial side were labelled on the top of each column. The color and distribution area around the femur condyle, the meniscus, and tibial platea were changed. The stress distribution area on the femur cartilage and tibial cartilage was almost identical. The femur, femur cartilage, menisci, tibial cartilage, and tibia of the intact knee joint were shown in the first line from left to right (A). The femur, femur cartilage, menisci, tibial cartilage, and tibia of the horizontal tear were shown in the second line from left to right (B). The femur, femur cartilage, menisci, tibial cartilage, and tibia of the peripheral tear were shown in the third line from left to right (C). The femur, femur cartilage, menisci, tibial cartilage, and tibia of and the longitudinal tear were shown in the fourth line from left to right (D).
Figure 4
Figure 4
The results of the shear stress (Tresca stress) in the static stance simulation. The color changed from red to deep blue that represented the stress variation from large to small on the stress nephogram. The same threshold was applied for the same region. The lateral and medial side were labelled on the top of each column. The stress-concentrated region and the color distribution were slightly diverse among different meniscus tears. The femur, femur cartilage, menisci, tibial cartilage, and tibia of the intact knee joint were shown in the first line from left to right (A). The femur, femur cartilage, menisci, tibial cartilage, and tibia of the horizontal tear were shown in the second line from left to right (B). The femur, femur cartilage, menisci, tibial cartilage, and tibia of the peripheral tear were shown in the third line from left to right (C). The femur, femur cartilage, menisci, tibial cartilage, and tibia of and the longitudinal tear were shown in the fourth line from left to right (D).
Figure 5
Figure 5
The maximum compression stress and shear stress applied on the knee joint in the slight flexion simulation. The maximum compression stress in the medial hemijoint (A), the prominent increase can be observed in longitudinal tear. The maximum compression stress in the lateral hemijoint (B), the notable increase of stress can be found on the tibia in longitudinal tear. The maximum shear stress in the medial hemijoint (C), the stress increased after meniscus tears, and the tibia in longitudinal tear shown the highest value. The maximum shear stress in the lateral hemijoint (D), the value for all kinds of tears was approximate.
Figure 6
Figure 6
The results of the compression stress (Min Principal stress) in the slight flexion simulation. The color change from deep blue to orange represented the stress variation from large to small on the stress nephogram. The same threshold was applied for the same region. The lateral and medial side were labelled on the top of each column. The compression stress concentration altered on both medial and lateral sides of the femur condyle, femur cartilage, and tibia. The stress distribution area and numerical value were highest in the longitudinal tear. The femur, femur cartilage, menisci, tibial cartilage, and tibia of the intact knee joint were shown in the first line from left to right (A). The femur, femur cartilage, menisci, tibial cartilage, and tibia of the horizontal tear were shown in the second line from left to right (B). The femur, femur cartilage, menisci, tibial cartilage, and tibia of the peripheral tear were shown in the third line from left to right (C). The femur, femur cartilage, menisci, tibial cartilage, and tibia of and the longitudinal tear were shown in the fourth line from left to right (D).
Figure 7
Figure 7
The results of the shear stress (Tresca stress) in the slight flexion simulation. The color change from red to deep blue indicated the stress variation from large to small on the stress nephogram. The same threshold was applied for the same region. The lateral and medial side were labelled on the top of each column. A prominent stress concentration was found on both sides of the femur and tibia after meniscus tears, and the red area was the biggest in the medial femur and tibia of longitudinal tear. The femur, femur cartilage, menisci, tibial cartilage, and tibia of the intact knee joint were shown in the first line from left to right (A). The femur, femur cartilage, menisci, tibial cartilage, and tibia of the horizontal tear were shown in the second line from left to right (B). The femur, femur cartilage, menisci, tibial cartilage, and tibia of the peripheral tear were shown in the third line from left to right (C). The femur, femur cartilage, menisci, tibial cartilage, and tibia of and the longitudinal tear were shown in the fourth line from left to right (D).
Figure 8
Figure 8
The imaging examination of knee OA. The X-ray (A) and 3D reconstruction (B) results of a 55-year old male patient showed that the medial compartment of the knee is markedly narrowed. The MRI (C) result of a 63-year old female patient revealed the subchondral bone osteonecrosis, and cystic degeneration can be observed in the femur and tibia.
Figure 9
Figure 9
The mechanical model of the meniscus was simplified using the parallel spring system (A), and the correlation curve between stiffness and deformation increased linearly (B).

References

    1. Messner K, Gao J. The menisci of the knee joint. Anatomical and functional characteristics, and a rationale for clinical treatment. J Anat. 1998;193:161–78. - PMC - PubMed
    1. Mcdermott ID, Amis AA. The consequences of meniscectomy. J Bone Joint Surg Br. 2006;88:1549–56. - PubMed
    1. Englund M, Guermazi A, Lohmander LS. The meniscus in knee osteoarthritis. Rheumatic Diseases Clinics of North America. 2009;35:579. - PubMed
    1. Mcdermott I. Meniscal tears, repairs and replacement: their relevance to osteoarthritis of the knee. Br J Sports Med. 2011;45:292–7. - PubMed
    1. Verdonk R, Madry H, Shabshin N, Dirisamer F, Peretti GM, Pujol N, Spalding T, Verdonk P, Seil R, Condello V. The role of meniscal tissue in joint protection in early osteoarthritis. Knee Surg Sports Traumatol Arthrosc. 2016;24:1763–74. - PubMed

LinkOut - more resources