

Exploring potential biomarkers of early stage esophageal squamous cell carcinoma in pre- and post-operative serum metabolomic fingerprint spectrum using 1H-NMR method
- PMID: 30899382
- PMCID: PMC6413262
Exploring potential biomarkers of early stage esophageal squamous cell carcinoma in pre- and post-operative serum metabolomic fingerprint spectrum using 1H-NMR method
Abstract
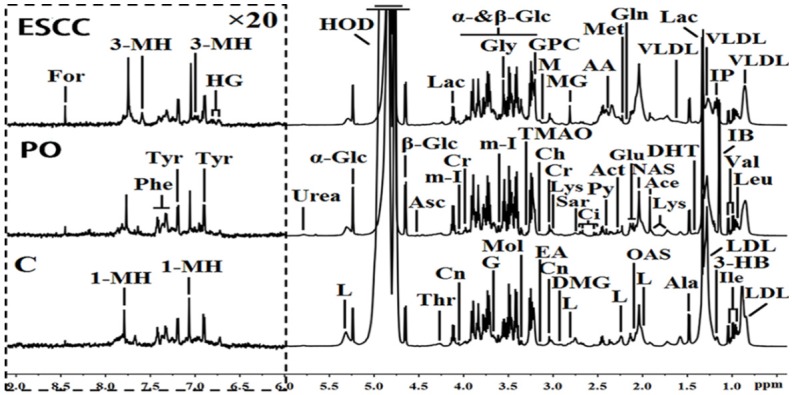
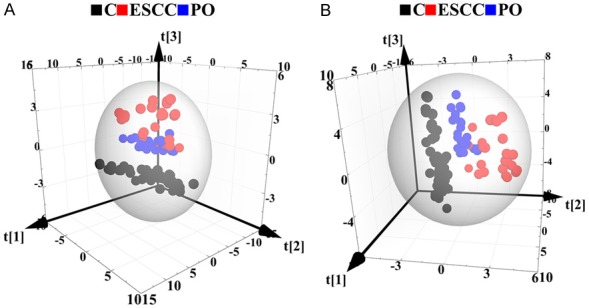
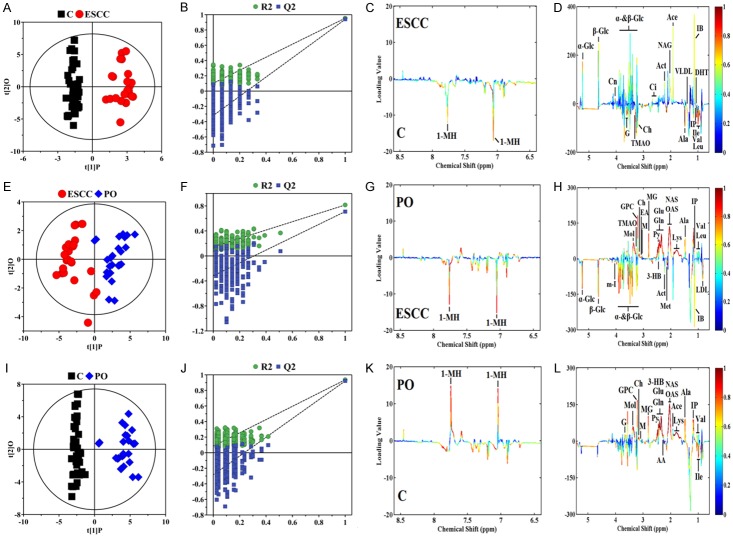
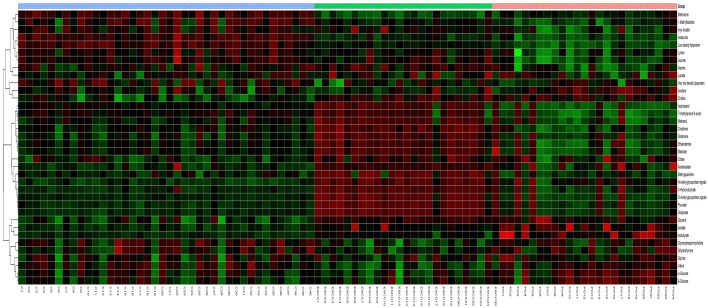
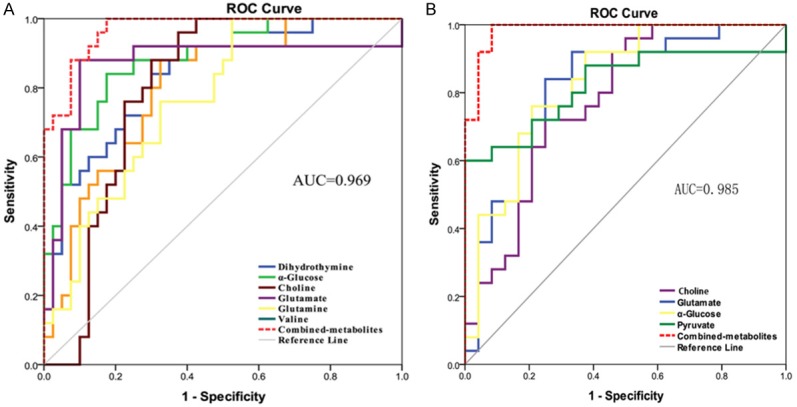
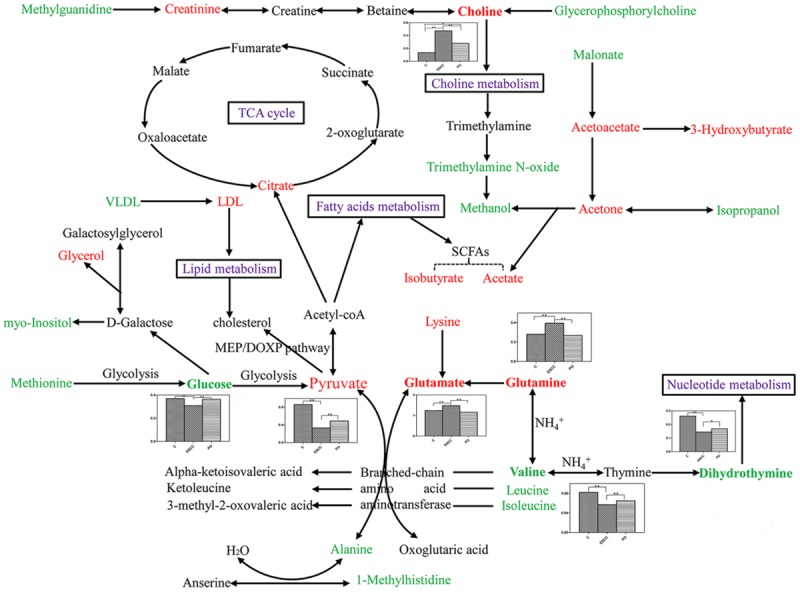
Esophageal squamous cell carcinoma (ESCC) is one of the most prevalent types of upper gastrointestinal malignancy. Here, we used 1H nuclear magnetic resonance spectroscopy (1H-NMR) to identify potential pre- and post-operative serum biomarkers in patients with early stage ESCC using metabolomic fingerprint spectrum. Serum samples from preoperative patients with ESCC (ESCC, n = 25), postoperative patients with ESCC (PO, n = 24), and controls (n = 40) were analysed using 1H-NMR spectroscopy. Using orthogonal partial least squares-discriminant analysis, 31 altered serum metabolites were successfully identified among the three groups. These metabolites are indicative of the changes that occur with glycometabolism, the metabolism of fatty acids, amino acids, choline, ketone bodies, nucleotides, and lipids. Based on receiver operating characteristic (ROC) curve analysis and a biomarker panel with an area under the curve (AUC) of 0.969, six serum metabolites (α-glucose, choline, glutamine, glutamate, valine, and dihydrothymine) were selected as potential diagnostic biomarkers for early stage ESCC. Additionally, four potential PO biomarkers (α-glucose, pyruvate, glutamate, and valine) with an AUC of 0.985 were selected to distinguish ESCC and PO. Many metabolites trended towards normalisation in PO patients, with only choline remaining high with an AUC of 0.858, suggesting that it may be a valuable potential biomarker for neoplasm progression, recurrence, chemoradiotherapy, and prognosis. 1H-NMR spectroscopy may be a useful tumour detection approach in the early diagnosis of ESCC. These results also indicate that it is useful to differentiate pre- and post-operative ESCC, evaluate surgery therapeutic responses, and monitor postoperative chemoradiotherapy.
Keywords: 1H-NMR spectroscopy; Esophageal squamous cell carcinoma; biomarker; metabolomics.
Conflict of interest statement
None.
Figures
Similar articles
-
1H-NMR spectroscopy identifies potential biomarkers in serum metabolomic signatures for early stage esophageal squamous cell carcinoma.PeerJ. 2019 Nov 29;7:e8151. doi: 10.7717/peerj.8151. eCollection 2019. PeerJ. 2019. PMID: 31803539 Free PMC article.
-
Global and targeted metabolomics of esophageal squamous cell carcinoma discovers potential diagnostic and therapeutic biomarkers.Mol Cell Proteomics. 2013 May;12(5):1306-18. doi: 10.1074/mcp.M112.022830. Epub 2013 Feb 8. Mol Cell Proteomics. 2013. PMID: 23397110 Free PMC article.
-
A multi-platform metabolomics reveals possible biomarkers for the early-stage esophageal squamous cell carcinoma.Anal Chim Acta. 2022 Aug 8;1220:340038. doi: 10.1016/j.aca.2022.340038. Epub 2022 Jun 8. Anal Chim Acta. 2022. PMID: 35868700
-
Untargeted Metabolomics Analysis of Esophageal Squamous Cell Carcinoma Discovers Dysregulated Metabolic Pathways and Potential Diagnostic Biomarkers.J Cancer. 2020 Apr 6;11(13):3944-3954. doi: 10.7150/jca.41733. eCollection 2020. J Cancer. 2020. PMID: 32328198 Free PMC article.
-
Exploring metabolomic dynamics in acute stress disorder: amino acids, lipids, and carbohydrates.Front Genet. 2024 Jul 25;15:1394630. doi: 10.3389/fgene.2024.1394630. eCollection 2024. Front Genet. 2024. PMID: 39119583 Free PMC article. Review.
Cited by
-
Serum Metabolomics for Biomarker Screening of Esophageal Squamous Cell Carcinoma and Esophageal Squamous Dysplasia Using Gas Chromatography-Mass Spectrometry.ACS Omega. 2020 Oct 12;5(41):26402-26412. doi: 10.1021/acsomega.0c02600. eCollection 2020 Oct 20. ACS Omega. 2020. PMID: 33110968 Free PMC article.
-
Metabolomic study of soft corals from the Colombian Caribbean: PSYCHE and 1H-NMR comparative analysis.Sci Rep. 2020 Mar 25;10(1):5417. doi: 10.1038/s41598-020-62413-0. Sci Rep. 2020. PMID: 32214197 Free PMC article.
-
Plasma Choline as a Diagnostic Biomarker in Slow Coronary Flow.Cardiol Res Pract. 2020 Jan 25;2020:7361434. doi: 10.1155/2020/7361434. eCollection 2020. Cardiol Res Pract. 2020. PMID: 32411450 Free PMC article.
-
Serum metabolomics analysis for the progression of esophageal squamous cell carcinoma.J Cancer. 2021 Apr 2;12(11):3190-3197. doi: 10.7150/jca.54429. eCollection 2021. J Cancer. 2021. PMID: 33976728 Free PMC article.
-
New Metabolic Alterations and A Predictive Marker Pipecolic Acid in Sera for Esophageal Squamous Cell Carcinoma.Genomics Proteomics Bioinformatics. 2022 Aug;20(4):670-687. doi: 10.1016/j.gpb.2021.08.016. Epub 2022 Mar 26. Genomics Proteomics Bioinformatics. 2022. PMID: 35351627 Free PMC article.
References
-
- Lambert R, Hainaut P. The multidisciplinary management of gastrointestinal cancer. Epidemiology of oesophagogastric cancer. Best Pract Res Clin Gastroenterol. 2007;21:921–945. - PubMed
-
- Kuwahara A, Yamamori M, Nishiguchi K, Okuno T, Chayahara N, Miki I, Tamura T, Kadoyama K, Inokuma T, Takemoto Y, Nakamura T, Kataoka K, Sakaeda T. Effect of dose-escalation of 5-fluorouracil on circadian variability of its pharmacokinetics in Japanese patients with Stage III/IVa esophageal squamous cell carcinoma. Int J Med Sci. 2010;7:48–54. - PMC - PubMed
-
- Zhang A, Sun H, Wang P, Wang X. Salivary proteomics in biomedical research. Clin Chim Acta. 2013;415:261–265. - PubMed
LinkOut - more resources
Full Text Sources