. 2019 Mar 1;10(18):1669-1687.
doi: 10.18632/oncotarget.26707.

A targeted genomic alteration analysis predicts survival of melanoma patients under BRAF inhibitors

Affiliations

A targeted genomic alteration analysis predicts survival of melanoma patients under BRAF inhibitors

Baptiste Louveau et al. Oncotarget. .

Abstract

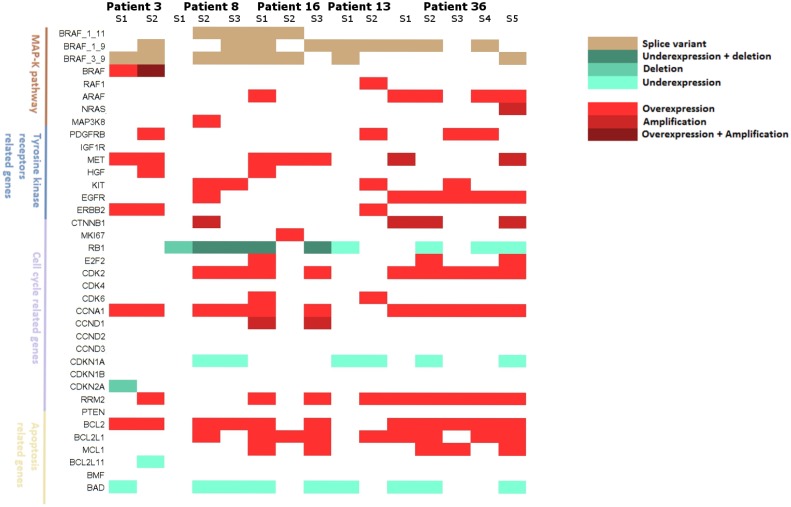
Several mechanisms have been described to elucidate the emergence of resistance to MAPK inhibitors in melanoma and there is a crucial need for biomarkers to identify patients who are likely to achieve a better and long-lasting response to BRAF inhibitors therapy. In this study, we developed a targeted approach combining both mRNA and DNA alterations analysis focusing on relevant gene alterations involved in acquired BRAF inhibitor resistance. We collected baseline tumor samples from 64 melanoma patients at BRAF inhibitor treatment initiation and showed that the presence, prior to treatment, of mRNA over-expression of genes' subset was significantly associated with improved progression free survival and overall survival. The presence of DNA alterations was in favor of better overall survival. The genomic analysis of relapsed-matched tumor samples from 20 patients allowed us to uncover the largest landscape of resistance mechanisms reported to date as at least one resistance mechanism was identified for each patient studied. Alterations in RB1 have been most frequent and hence represent an important additional acquired resistance mechanism. Our targeted genomic analysis emerges as a relevant tool in clinical practice to identify those patients who are more likely to achieve durable response to targeted therapies and to exhaustively describe the spectrum of resistance mechanisms. Our approach can be adapted to new targeted therapies by including newly identified genetic alterations.

Keywords: BRAF inhibitors; melanoma; predictive analysis; targeted genomic alteration; targeted therapy resistance.


Conflict of interest statement

CONFLICTS OF INTEREST BL, JD, CRdM, LG, FJ, AS, MPP, IC, OM, JC, JPF and ND have no conflicts of interest to declare. MB declares a consulting role for Histalim, Bristol-Myers Squibb, and Innate Pharma. SD is a principal investigator in studies conducted by Roche-Genentech and Novartis. CL declares honoraria from Roche, advisory roles at Roche, GSK, Novartis, BMS, MSD, and Amgen and travel accommodation provided by Roche. SM declares a consulting role at Roche, Janssen and Novartis.

Figures

Figure 1
Figure 1. Swimmer plot of the 64 patients included and ranked according to their overall survival
Patients are censored at last available date of follow-up if disease progression or death did not occur. T0 is the time of BRAF inhibitor initiation.
Figure 2
Figure 2
Baseline DNA alterations: (A) Landscape of baseline DNA alterations for the 63 patients with available data (1 missing). Patients are ranked according to their overall survival. Mutations are represented in blue, Amplifications and deletions are red and green respectively. (mut: mutations; CNV: Copy number variations). (B) Kaplan Meier curves for overall survival comparing patients with at least one DNA alteration at baseline (n = 50) versus patients with no DNA alteration at baseline (n = 13). Log-rank test was performed to compute the P-value (Univariate analysis). (OS: Overall survival).
Figure 3
Figure 3. Heatmaps of baseline mRNA expression for the 64 patients included
Color represents the relative expression of each gene in each sample, centered on the mean and scaled to the standard deviation. Blue is low expression and red is high expression. (A) Heatmap of unsupervised clustering. Patients are defined according to their progression status 6 months after therapy initiation (Progression vs No progression). (B) Heatmap of supervised clustering. Patients are ranked according to their progression free survival. (C) Heatmap of supervised clustering. Patients are ranked according to their overall survival.
Figure 4
Figure 4. Kaplan–Meier curves assuming the survival in high risk patients and low-risk patients
(A) Progression free survival associated with selected baseline clinical variables (sex and presence of brain metastasis). (B) Overall survival associated with selected baseline clinical variables (sex and presence of brain metastasis). (C) Progression free survival associated with gene expression only. (D) Overall survival associated with gene expression only. (E) Progression free survival associated with gene expression adjusted on selected clinical variables. (F) Overall survival associated with gene expression adjusted on selected clinical variables. Log-rank tests were performed to compute P-values. (OS: Overall survival; PFS: Progression free survival).
Figure 5
Figure 5. Landscape of mRNA expressions and DNA alterations at relapse reported to baseline status
Figure 6
Figure 6. pRB expression and pRB/E2F1 interaction in tumors
(A) Representative pictures of immunohistochemical staining of pRB on sections of baseline and relapse tumor samples. Baseline sample shows a slight diffuse cytoplasmic staining versus no staining in the relapse sample, magnification ×400. (B) Representative pictures of in situ proximity ligation assay (PLA) demonstrating pRB and E2F1 interaction in tumor sections at baseline and relapse from 2 melanoma patients. pRB-E2F1 heterodimerization was visualized as red dots by in situ PLA and was detected with a fluorescent Axiovert microscopy # patient 1 and fluorescent Axiovert (left) and confocal microscopy (right) # patient 2; cell nuclei were stained with DAPI (blue), magnification ×63. (C) Representative pictures of in situ proximity ligation assay (PLA) demonstrating phospho-pRB and E2F1 interaction in tumor sections at baseline and relapse from a melanoma patient. Phospho-pRB-E2F1 heterodimerization was visualized as red dots by in situ PLA and was detected with confocal microscopy; cell nuclei were stained with DAPI (blue), magnification ×20.
Figure 7
Figure 7. In vitro studies of RB1
(A) RB1 transcript expression in vemurafenib sensitive A375 cells (A375-S) and resistant A375 cells (A375-R). **p < 0.001. Bars represent means from three independent experiments. (B) Western blot analysis of the levels of phospho-pRB, pRB in the vemurafenib sensitive parental A375 cells and vemurafenib resistant A375 cells. Actin was used as internal control. Representative blots of three independent experiments are shown. (C) Representative pictures of expression of pRB in vemurafenib sensitive and resistant A375 cells assessed with confocal microscopy; cell nuclei were stained with DAPI (blue); magnification ×63. (D) Representative pictures of in situ proximity ligation assay (PLA) demonstrating pRB/E2F1 interactions in A375 melanoma cells sensitive (A375-S) or resistant (A375-R) to vemurafenib. pRB-E2F1 heterodimerization was visualized as red dots by in situ PLA and was detected with a confocal microscopy; cell nuclei were stained with DAPI (blue); magnification ×63. (E) Proliferation assay in SKMEL-5 and A375 cell lines undergoing a RB1 downregulation with RNA interference and treated or not with vemurafenib 1 μM. Bars represent means from three independent experiments. *p < 0.01 (siRNA Control: small interfering RNA control; siRNA RB1: small interfering RNA RB1, OD: Optical density).
Figure 8
Figure 8. Landscape of resistance mechanisms addressed by patients with collection of multiple relapse samples
Patients 3 and 13 had 2 relapsed biopsies, Patients 8 and 16 had 3 relapsed biopsies and patient 36 had 5 relapsed biopsies. mRNA expressions and DNA alterations at relapse are reported to baseline status.

References

    1. Sosman JA, Kim KB, Schuchter L, Gonzalez R, Pavlick AC, Weber JS, McArthur GA, Hutson TE, Moschos SJ, Flaherty KT, Hersey P, Kefford R, Lawrence D, et al. Survival in BRAF V600-mutant advanced melanoma treated with vemurafenib. N Engl J Med. 2012;366:707–14. doi: 10.1056/NEJMoa1112302. - DOI - PMC - PubMed
    1. Chapman PB, Hauschild A, Robert C, Haanen JB, Ascierto P, Larkin J, Dummer R, Garbe C, Testori A, Maio M, Hogg D, Lorigan P, Lebbe C, et al. BRIM-3 Study Group Improved survival with vemurafenib in melanoma with BRAF V600E mutation. N Engl J Med. 2011;364:2507–16. doi: 10.1056/NEJMoa1103782. - DOI - PMC - PubMed
    1. Hauschild A, Grob JJ, Demidov LV, Jouary T, Gutzmer R, Millward M, Rutkowski P, Blank CU, Miller WH, Jr, Kaempgen E, Martín-Algarra S, Karaszewska B, Mauch C, et al. Dabrafenib in BRAF-mutated metastatic melanoma: a multicentre, open-label, phase 3 randomised controlled trial. Lancet. 2012;380:358–65. doi: 10.1016/S0140-6736(12)60868-X. - DOI - PubMed
    1. Flaherty KT, Puzanov I, Kim KB, Ribas A, McArthur GA, Sosman JA, O’Dwyer PJ, Lee RJ, Grippo JF, Nolop K, Chapman PB. Inhibition of mutated, activated BRAF in metastatic melanoma. N Engl J Med. 2010;363:809–19. doi: 10.1056/NEJMoa1002011. - DOI - PMC - PubMed
    1. Long GV, Stroyakovskiy D, Gogas H, Levchenko E, de Braud F, Larkin J, Garbe C, Jouary T, Hauschild A, Grob JJ, Chiarion-Sileni V, Lebbe C, Mandalà M, et al. Dabrafenib and trametinib versus dabrafenib and placebo for Val600 BRAF-mutant melanoma: a multicentre, double-blind, phase 3 randomised controlled trial. Lancet. 2015;386:444–51. doi: 10.1016/S0140-6736(15)60898-4. - DOI - PubMed