Evolving data analysis of an Oral Lipid Tolerance Test toward the standard for the Oral Glucose Tolerance Test: Cross species modeling effects of AZD7687 on plasma triacylglycerol
- PMID: 30899516
- PMCID: PMC6408865
- DOI: 10.1002/prp2.465
Evolving data analysis of an Oral Lipid Tolerance Test toward the standard for the Oral Glucose Tolerance Test: Cross species modeling effects of AZD7687 on plasma triacylglycerol
Abstract
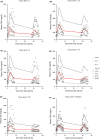
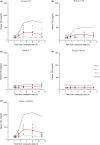
We have developed a novel mechanistic pharmacokinetic-pharmacodynamic (PK/PD) model to describe the time course of plasma triglyceride (TAG) after Oral Lipid Tolerance Test (OLTT) and the effects of AZD7687, an inhibitor of diacylglycerol acyltransferase 1 (DGAT1), in humans, rats, and mice. Pharmacokinetic and plasma TAG data were obtained both in animals and in two phase I OLTT studies. In the PK/PD model, the introduction of exogenous TAG is represented by a first order process. The endogenous production and removal of TAG from plasma are described with a turnover model. AZD7687 inhibits the contribution of exogenous TAG into circulation. One or two compartment models with first order absorption was used to describe the PK of AZD7687 for the different species. Nonlinear mixed effect modeling was used to fit the model to the data. The effects of AZD7687 on the plasma TAG time course during an OLTT as well as interindividual variability were well described by the model in all three species. Meal fat content or data from single vs repeated dosing did not affect model parameter estimates. Body mass index was found to be a significant covariate on the plasma TAG baseline. The system parameters of the model will facilitate analysis for other compounds and provide tools to bring the standard of OLTT data analysis closer to the analyses of Oral Glucose Tolerance Test data maximizing knowledge gain.
Keywords: AZD7687; DGAT1; mechanistic modeling; nonlinear mixed effect modeling; oral lipid tolerance test; pharmacodynamics; pharmacokinetics; triglyceride.
Conflict of interest statement
All authors were employees at AstraZeneca at the time the studies were carried out.
Figures


Similar articles
-
Proof of mechanism for the DGAT1 inhibitor AZD7687: results from a first-time-in-human single-dose study.Diabetes Obes Metab. 2013 Feb;15(2):136-43. doi: 10.1111/dom.12002. Epub 2012 Sep 30. Diabetes Obes Metab. 2013. PMID: 22950654 Clinical Trial.
-
Diacylglycerol acyltransferase 1 inhibition with AZD7687 alters lipid handling and hormone secretion in the gut with intolerable side effects: a randomized clinical trial.Diabetes Obes Metab. 2014 Apr;16(4):334-43. doi: 10.1111/dom.12221. Epub 2013 Oct 31. Diabetes Obes Metab. 2014. PMID: 24118885 Clinical Trial.
-
Design and optimization of pyrazinecarboxamide-based inhibitors of diacylglycerol acyltransferase 1 (DGAT1) leading to a clinical candidate dimethylpyrazinecarboxamide phenylcyclohexylacetic acid (AZD7687).J Med Chem. 2012 Dec 13;55(23):10610-29. doi: 10.1021/jm301296t. Epub 2012 Nov 21. J Med Chem. 2012. PMID: 23116186
-
Intestinal triacylglycerol synthesis in fat absorption and systemic energy metabolism.J Lipid Res. 2015 Mar;56(3):489-501. doi: 10.1194/jlr.R052902. Epub 2014 Sep 17. J Lipid Res. 2015. PMID: 25231105 Free PMC article. Review.
-
Glycerolipid acyltransferases in triglyceride metabolism and energy homeostasis-potential as drug targets.Endocr Metab Immune Disord Drug Targets. 2012 Jun;12(2):197-206. doi: 10.2174/187153012800493459. Endocr Metab Immune Disord Drug Targets. 2012. PMID: 22385114 Review.
Cited by
-
Progress of potential drugs targeted in lipid metabolism research.Front Pharmacol. 2022 Dec 16;13:1067652. doi: 10.3389/fphar.2022.1067652. eCollection 2022. Front Pharmacol. 2022. PMID: 36588702 Free PMC article. Review.
-
Lipid metabolism in sickness and in health: Emerging regulators of lipotoxicity.Mol Cell. 2021 Sep 16;81(18):3708-3730. doi: 10.1016/j.molcel.2021.08.027. Mol Cell. 2021. PMID: 34547235 Free PMC article. Review.
-
Evaluating the appropriate oral lipid tolerance test model for investigating plasma triglyceride elevation in mice.PLoS One. 2020 Oct 6;15(10):e0235875. doi: 10.1371/journal.pone.0235875. eCollection 2020. PLoS One. 2020. PMID: 33022003 Free PMC article.
-
Daily Consumption of α-Linolenic Acid Increases Conversion Efficiency to Eicosapentaenoic Acid in Mice.Nutrients. 2024 May 7;16(10):1407. doi: 10.3390/nu16101407. Nutrients. 2024. PMID: 38794645 Free PMC article.
-
Assessing Insulin Sensitivity and Postprandial Triglyceridemic Response Phenotypes With a Mixed Macronutrient Tolerance Test.Front Nutr. 2022 May 11;9:877696. doi: 10.3389/fnut.2022.877696. eCollection 2022. Front Nutr. 2022. PMID: 35634390 Free PMC article.
References
-
- Gabrielsson J, Hjorth S, Vogg B, et al. Modeling and design of challenge tests: inflammatory and metabolic biomarker study examples. Eur J Pharm Sci. 2015;67:144‐159. - PubMed
-
- Jauslin PM, Silber HE, Frey N, et al. An integrated glucose‐insulin model to describe oral glucose tolerance test data in type 2 diabetics. J Clin Pharmacol. 2007;47:1244‐1255. - PubMed
-
- Møller JB, Overgaard RV, Madsen H, Hansen T, Pedersen O, Ingwersen SH. Predictive performance for population models using stochastic differential equations applied on data from an oral glucose tolerance test. J Pharmacokinet Pharmacodyn. 2010;37:85‐98. - PubMed
Publication types
MeSH terms
Substances
LinkOut - more resources
Full Text Sources

