. 2019 Mar 1;184(Suppl 1):218-227.
doi: 10.1093/milmed/usy394.

A Novel Gradient Echo Plural Contrast Imaging Method Detects Brain Tissue Abnormalities in Patients With TBI Without Evident Anatomical Changes on Clinical MRI: A Pilot Study

Affiliations

A Novel Gradient Echo Plural Contrast Imaging Method Detects Brain Tissue Abnormalities in Patients With TBI Without Evident Anatomical Changes on Clinical MRI: A Pilot Study

Serguei V Astafiev et al. Mil Med. .

Abstract

Research objectives: It is widely accepted that mild traumatic brain injury (mTBI) causes injury to the white matter, but the extent of gray matter (GM) damage in mTBI is less clear.

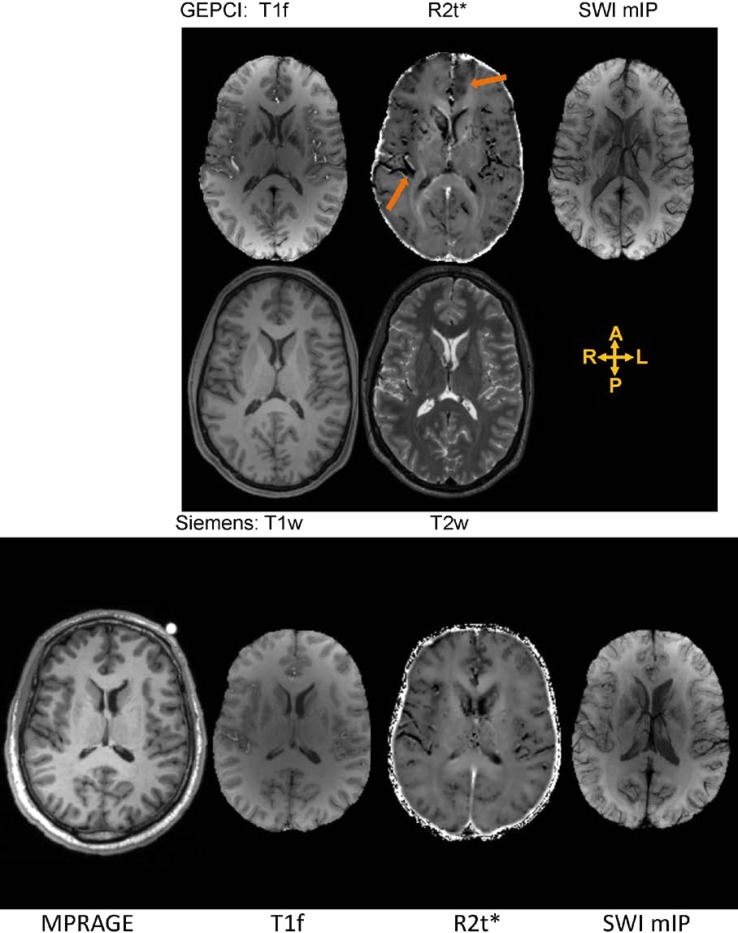
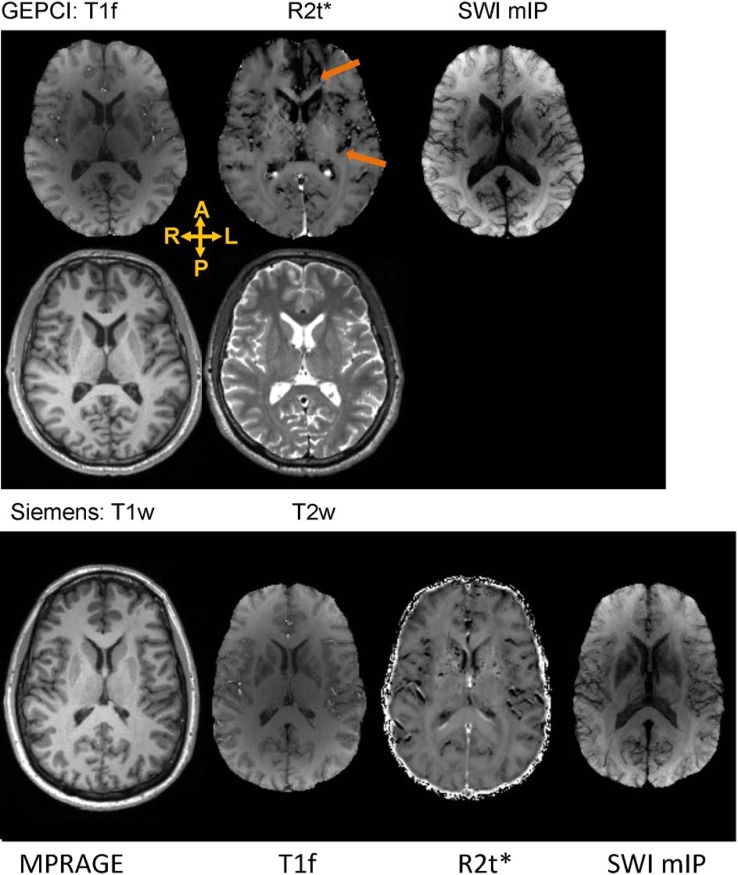
Methods: We tested 26 civilian healthy controls and 14 civilian adult subacute-chronic mTBI patients using quantitative features of MRI-based Gradient Echo Plural Contrast Imaging (GEPCI) technique. GEPCI data were reconstructed using previously developed algorithms allowing the separation of R2t*, a cellular-specific part of gradient echo MRI relaxation rate constant, from global R2* affected by BOLD effect and background gradients.

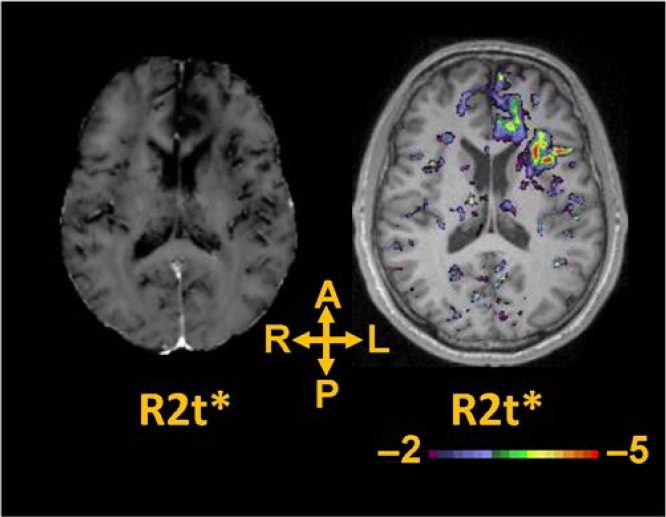
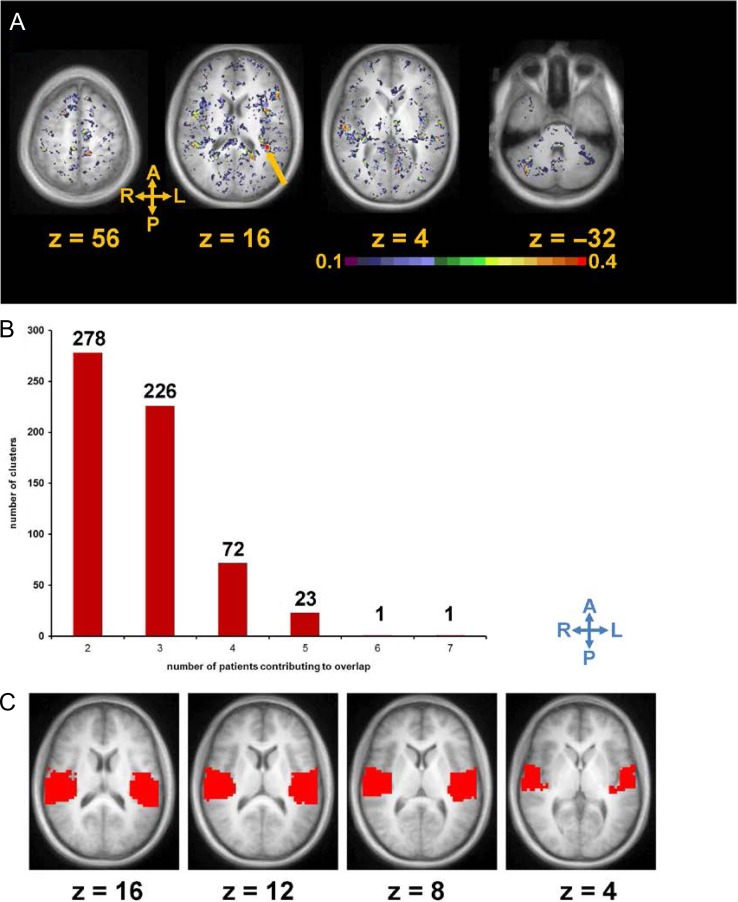
Results: Single-subject voxel-wise analysis (comparing each mTBI patient to the sample of 26 control subjects) revealed GM abnormalities that were not visible on standard MRI images (T1w and T2w). Analysis of spatial overlap for voxels with low R2t* revealed tissue abnormalities in multiple GM regions, especially in the frontal and temporal regions, that are frequently damaged after mTBI. The left posterior insula was the region with abnormalities found in the highest proportion (50%) of mTBI patients.

Conclusions: Our data suggest that GEPCI quantitative R2t* metric has potential to detect abnormalities in GM cellular integrity in individual TBI patients, including abnormalities that are not detectable by a standard clinical MRI.

Keywords: MRI; Traumatic Brain Injury; gray matter.


Figures

FIGURE 1.
FIGURE 1.
Top row: Images generated from a single GEPCI scan in a 29-year-old male mTBI subject 3.1 months post-injury. The subject had two HISC symptoms (headaches and memory problems). Images are: T1f (combination of T1 weighted and frequency map with improved over GEPCI T1W image WM/GM contrast), R2t* and SWI. SWI image represent SWI minimum intensity projection (mIP) across five slices. Arrows point to the dark area in the left frontal lobe and right posterior insula on R2t* (image is in radiological orientation). Second row: Siemens sequences (T1w, T2w) displaying similar axial slice. Bottom row: images from control subject (35-year-old male) A: anterior, P: posterior, R: right, L: left.
FIGURE 2.
FIGURE 2.
Top row: Images generated from a GEPCI scan obtained in a 45-year-old male mTBI patient who was 39.7 months post-injury. He had only one HISC symptom of headache. Images are: T1f (combination of T1 weighted and frequency map with improved WM/GM contrast), R2t* and SWI. The SWI image represents SWI minimum intensity projection across 5 slices. The arrows point to a hypointense areas in the left frontal lobe and posterior insula on the R2t* map. Second row: Siemens sequences (T1w, T2w) displaying similar axial slice. Bottom row: images from gender/age matched control subject (43-year-old male). A: anterior, P: posterior, R: right, L: left.
FIGURE 3.
FIGURE 3.
Images in standard space generated from a single GEPCI scan in the 45-year-old mTBI male subject from Figure 2 (39.7 months post-injury with 1 HISC symptom of headache). Left: R2t* image in a standard space. R2t* image demonstrates significantly lower R2t* values in several cortical areas. Right: z map thresholded at z < −2 (p < 0.05 uncorrected) displayed superimposed on the MPRAGE scan at the same axial level.
FIGURE 4.
FIGURE 4.
Cluster analysis of tissue damage in a cohort of 14 TBI patients displayed with color coding representing the frequency of damage noted in different regions. (A): Averages of 14 binary images in which each subject has been compared voxel by voxel to the entire healthy cohort using R2t*. A value of 0.5 means that particular voxel was significantly lower than controls in 50% of images (in 7 of 14 mTBI patients). The arrow points to a cluster of abnormal voxels with the highest degree of commonality among the mTBI subjects, in left posterior insula. (B) Number of clusters vs. number of patients contributing to overlap. (C) Spatial location of region containing posterior insula selected from 26 functional ROIs defined in previously published rs-fcfMRI analysis.

References

    1. Faul M, Xu L, Wald MM, Coronado VG: Traumatic Brain Injury in the United States: Emergency Department Visits, Hospitalizations, and Deaths. Atlanta (GA), Centers for Disease Control and Prevention, National Center for Injury Prevention and Control, 2010.
    1. Chen AJ, D’Esposito M: Traumatic brain injury: from bench to bedside [corrected] to society. Neuron 2010; 66(1): 11–4. - PubMed
    1. McAllister TW: Neurobiological consequences of traumatic brain injury. Dialogues Clin Neurosci 2011; 13(3): 287–300. - PMC - PubMed
    1. Crooks CY, Zumsteg JM, Bell KR: Traumatic brain injury: a review of practice management and recent advances. Phys Med Rehabil Clin N Am 2007; 18(4): 681–710. vi. - PubMed
    1. Amyot F, Arciniegas DB, Brazaitis MP, et al. : A review of the effectiveness of neuroimaging modalities for the detection of traumatic brain injury. J Neurotrauma 2015; 32(22): 1693–721. - PMC - PubMed

Publication types