Review
. 2019 Mar 21;177(1):146-161.
doi: 10.1016/j.cell.2019.02.024.

The Genetic Basis of Metabolic Disease

Affiliations
Review

The Genetic Basis of Metabolic Disease

Inês Barroso et al. Cell. .

Abstract

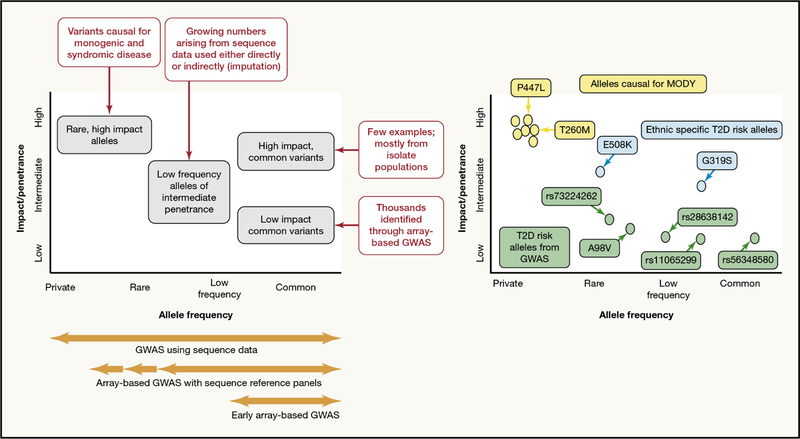
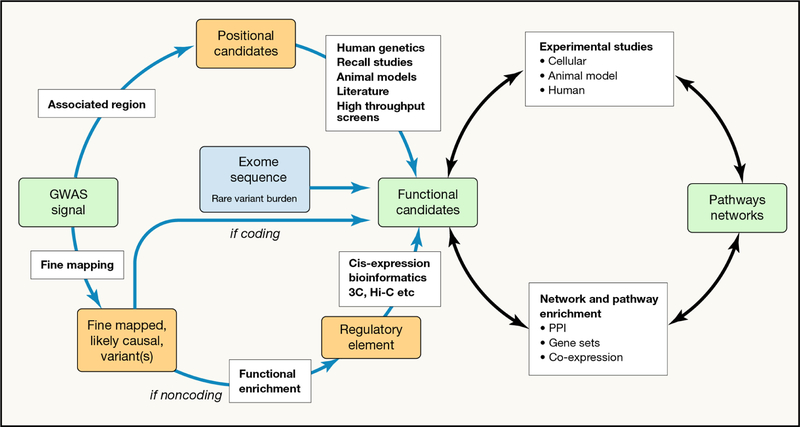
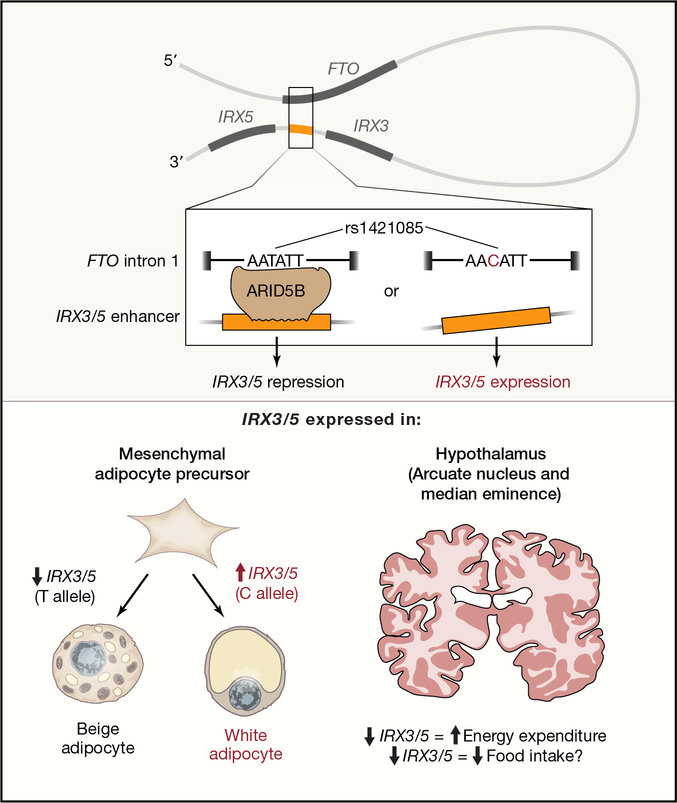
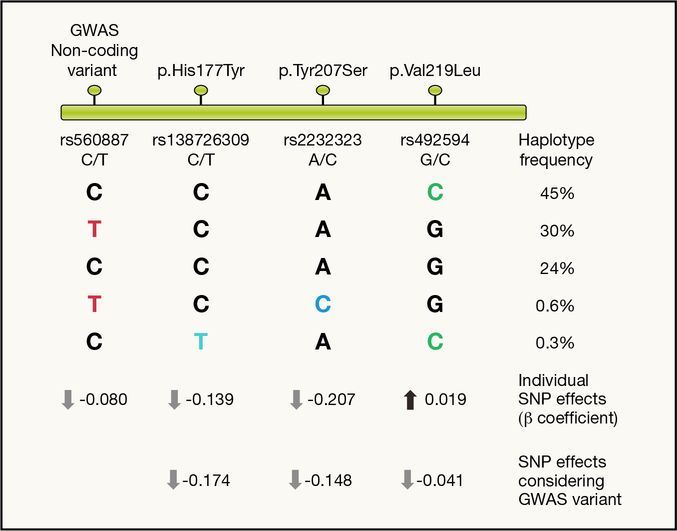
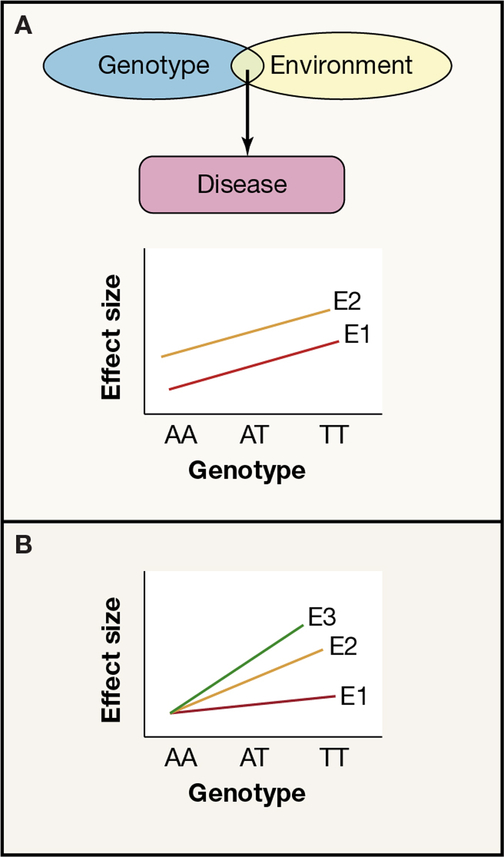
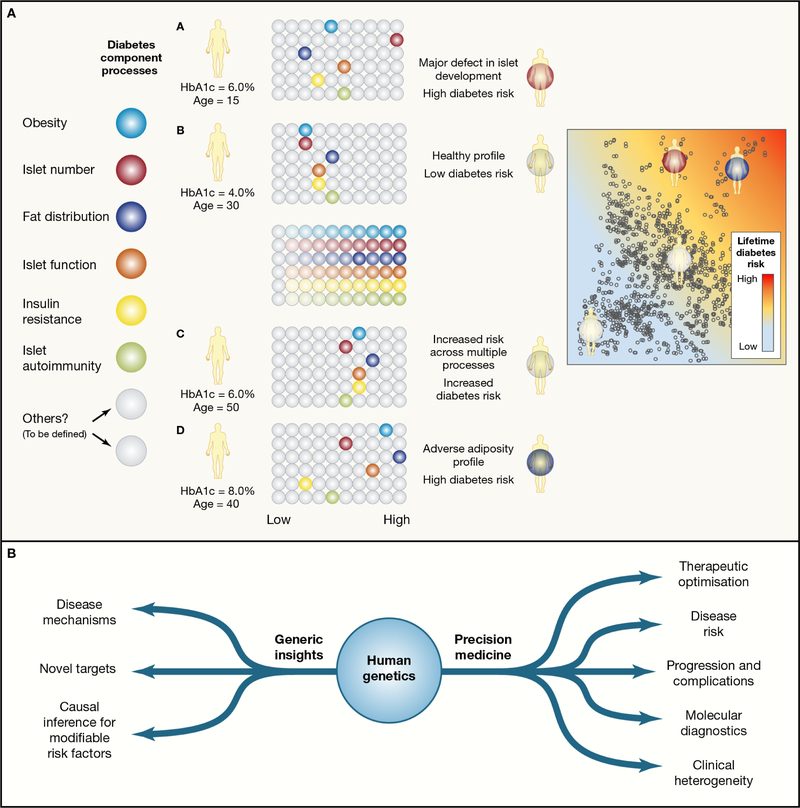
Recent developments in genetics and genomics are providing a detailed and systematic characterization of the genetic underpinnings of common metabolic diseases and traits, highlighting the inherent complexity within systems for homeostatic control and the many ways in which that control can fail. The genetic architecture underlying these common metabolic phenotypes is complex, with each trait influenced by hundreds of loci spanning a range of allele frequencies and effect sizes. Here, we review the growing appreciation of this complexity and how this has fostered the implementation of genome-scale approaches that deliver robust mechanistic inference and unveil new strategies for translational exploitation.


Figures

Figure 1 -
Figure 1 -. The allelic spectrum of effects contributing to disease risk
The left panel highlights that contributions to variance in a trait of interest may come from variants across the allele spectrum. Most of the common variants identified by GWAS for complex multifactorial have modest effects, though there are some exceptions. Rare, high impact alleles are most relevant to monogenic and syndromic forms of disease but contribute to some extent to phenotypic variance at the population-level. The right panel illustrates the range of variants in one gene (HNF1A) with a proven or potential impact on diabetes risk: this includes rare variants causal for monogenic forms of diabetes (yellow), common and low-frequency variants of modest effect influencing T2D-risk (green), and additional ethnic-specific variants with more substantial effects on T2D-risk in selected populations (blue).
Figure 2 -
Figure 2 -. A schema for generating biological and clinical insights from human genetic findings
Given a set of (largely non-coding) GWAS signals for a phenotype of interest, the aim is generally to identify the genes through which the effect is likely to be mediated (“positional candidates”) and the networks and pathways which are implicated. The first step (from signals to positional candidates) proceeds through a combination of evaluating nearby genes for their biological relevance to the trait of interest (upper left) and of linking fine-mapped causal variants to their transcriptional targets (lower left). Once candidates have been prioritised, experimental validation (through perturbation experiments in cellular and animal models) is essential, and the information gathered examined for evidence of networks and pathways causally implicated in disease pathogenesis (or trait variance). Abbreviations: PPI, protein-protein interaction; 3C, Chromosome conformation capture; Hi-C, a derivative of 3C methods.
Figure 3 -
Figure 3 -. Causal variants and proposed mechanism at the FTO locus
Variants within the first intron of FTO (top) make contact with regulatory regions close to the IRX3 and IRX5 genes. The BMI-raising allele (C), is proposed to disrupt the ARID5B repressor biding site leading to overexpression of IRX3/5. Consequently, differentiating adipocytes are directed towards white lipid storing, instead of beige, adipocytes (bottom panel). In the hypothalamus (right bottom), overexpression of IRX3/5 could lead to increased food intake and decreased energy expenditure. Adapted from Herman, M. A. and E. D. Rosen (2015). “Making Biological Sense of GWAS Data: Lessons from the FTO Locus.” Cell Metab 22(4): 538–539.
Figure 4 -
Figure 4 -. Coding variants at G6PC2/ABCB11 locus
Schematic representation of GWAS and coding variants mapping along the chromosome around the locus (top). Common haplotypes formed by the four variants are represented with their frequency. Coloured letters represent the glucose lowering allele based on in vitro assay results (black letters refer to the glucose raising allele). Estimating the effect of each SNP individually (black/coloured letter in each column) ignoring the background haplotype may lead to incorrect inferences regarding the effect of that variant on glucose levels. This effect is particularly evident for the p.Val219Leu (MAF=48%) where single SNP analysis estimates the effect of this variant to increase glucose levels, whereas functional data show it decreases glucose levels. When the effect of this variant is estimated conditioning on the effect of the GWAS index variant (i.e. taking account of its effect on glucose levels) it becomes apparent that Leu219 decreases glucose levels. These results are in agreement with in vitro results where p.Val219Leu was shown to decrease protein expression levels by 49%, in comparison to a 99% reduction (p.His177Tyr) and 100% reduction (Tyr207Ser) for the other two coding variants. This striking difference on protein expression levels is in agreement with the much more modest effects on fasting glucose for p.Val219Leu compared to the two other variants.
Figure 5 -
Figure 5 -. Effects of genes and environment on disease risk
Panel a) shows joint effects of genes and environment, but no GxE interaction. Both genotype and environment are needed to cause disease (above) but the effect of the genotype is the same across all environments (below- gradient of the lines E1 and E2 is the same), environment E2 increases the risk across all genotypes by the same amount. Panel b) illustrates a genotype x environment interaction (GxE) where the effect of the genotype on disease risk varies between different environments E1, E2, E3 (gradient of the lines is different).
Figure 6 -
Figure 6 -. Translational Opportunities
Panel a) Partitioned risk scores and the delivery of precision medicine (using type 2 diabetes as an example). For many complex diseases, individual predisposition reflects the aggregation of risk for multiple intermediary processes that contribute to the phenotype. A subset of those relevant to T2D risk are shown on the left, with each represented in terms of a base color. Each of these processes is subject to multifactorial (genetic and non genetic) influences. For any given individual, loadings for each of these processes may range from low- to high-risk. Overall risk of T2D will depend on how many are registering as “high risk”, but phenotypic presentation and clinical course may be more dependent on the patterns of risk across the processes. Note that individuals at high risk may have their disease profile dominated by a single process (such as individual A), or may simply have above average risk loadings across multiple processes (individuals C and D). Panel b) The translational value of human genetic data for complex metabolic phenotypes. Translational opportunities can be broadly divided into those that are related to providing generic insights into the processes underlying disease predisposition (or trait variance), and those that can be exploited to deliver information at the level of the individual, and support precision medicine approaches. Some examples of each are provided.

References

    1. Ahmad S, Rukh G, Varga TV, Ali A, Kurbasic A, Shungin D, Ericson U, Koivula RW, Chu AY, Rose LM, et al. (2013). “Gene x physical activity interactions in obesity: combined analysis of 111,421 individuals of European ancestry.” PLoS Genet 9(7): e1003607. - PMC - PubMed
    1. Ahmad T, Lee IM, Pare G, Chasman DI, Rose L, Ridker PM and Mora S (2011). “Lifestyle interaction with fat mass and obesity-associated (FTO) genotype and risk of obesity in apparently healthy U.S. women.” Diabetes Care 34(3): 675–680. - PMC - PubMed
    1. Altshuler D, Hirschhorn JN, Klannemark M, Lindgren CM, Vohl MC, Nemesh J, Lane CR, Schaffner SF, Bolk S, Brewer C, et al. (2000). “The common PPARgamma Pro12Ala polymorphism is associated with decreased risk of type 2 diabetes.” Nat Genet 26(1): 76–80. - PubMed
    1. Ameur A, Enroth S, Johansson A, Zaboli G, Igl W, Johansson AC, Rivas MA, Daly MJ, Schmitz G, Hicks AA, et al. (2012). “Genetic adaptation of fatty-acid metabolism: a human-specific haplotype increasing the biosynthesis of long-chain omega-3 and omega-6 fatty acids.” Am J Hum Genet 90(5): 809–820. - PMC - PubMed
    1. Amorim CE, Nunes K, Meyer D, Comas D, Bortolini MC, Salzano FM and Hunemeier T (2017). “Genetic signature of natural selection in first Americans.” Proc Natl Acad Sci U S A 114(9): 2195–2199. - PMC - PubMed

Publication types