Review
. 2019 Mar 21;177(1):162-183.
doi: 10.1016/j.cell.2019.01.015.

Defining the Genetic, Genomic, Cellular, and Diagnostic Architectures of Psychiatric Disorders

Affiliations
Review

Defining the Genetic, Genomic, Cellular, and Diagnostic Architectures of Psychiatric Disorders

Patrick F Sullivan et al. Cell. .

Abstract

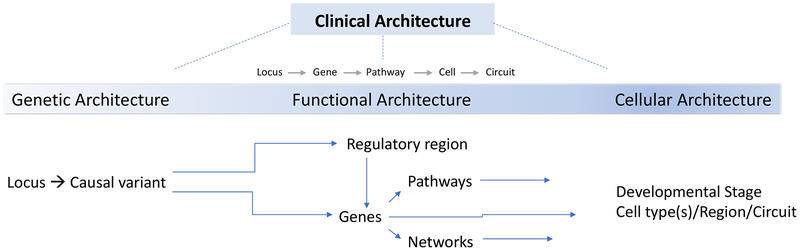
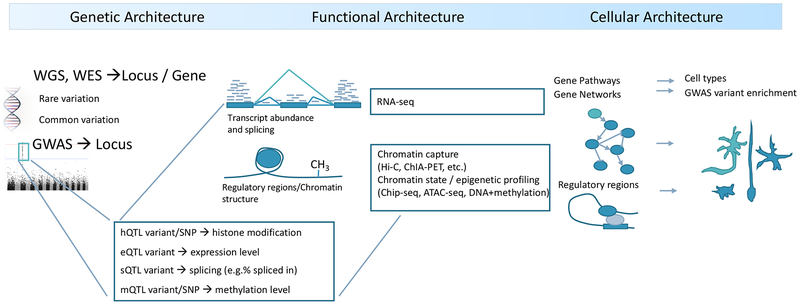
Studies of the genetics of psychiatric disorders have become one of the most exciting and fast-moving areas in human genetics. A decade ago, there were few reproducible findings, and now there are hundreds. In this review, we focus on the findings that have illuminated the genetic architecture of psychiatric disorders and the challenges of using these findings to inform our understanding of pathophysiology. The evidence is now overwhelming that psychiatric disorders are "polygenic"-that many genetic loci contribute to risk. With the exception of a subset of those with ASD, few individuals with a psychiatric disorder have a single, deterministic genetic cause; rather, developing a psychiatric disorder is influenced by hundreds of different genetic variants, consistent with a polygenic model. As progressively larger studies have uncovered more about their genetic architecture, the need to elucidate additional architectures has become clear. Even if we were to have complete knowledge of the genetic architecture of a psychiatric disorder, full understanding requires deep knowledge of the functional genomic architecture-the implicated loci impact regulatory processes that influence gene expression and the functional coordination of genes that control biological processes. Following from this is cellular architecture: of all brain regions, cell types, and developmental stages, where and when are the functional architectures operative? Given that the genetic architectures of different psychiatric disorders often strongly overlap, we are challenged to re-evaluate and refine the diagnostic architectures of psychiatric disorders using fundamental genetic and neurobiological data.


Conflict of interest statement

Conflicts

PF Sullivan reports the following potentially competing financial interests. Current: Lundbeck (advisory committee, grant recipient). Past three years: Pfizer (scientific advisory board), Element Genomics (consultation fee), and Roche (speaker reimbursement). DH Geschwind has the following disclosures: Research funding from Takeda pharmaceuticals, and serving as a scientific advisor for Falcon Computing, Ovid Therapeutics, Axial Biosciences, Acurastem, and Third Rock Ventures.

Figures

Figure 1:
Figure 1:. Relationship of the levels of disease architecture to different stages of analysis.
Genetic studies identify the loci and causal variants that impact disease and thereby its genetic architecture. The subset of causal variants in coding regions are typically directly assignable to genes. As many loci are non-coding, regulatory regions and the genes they regulate need to be empirically defined and identified – such studies render the functional architecture of disease. As psychiatric disorders all appear to be polygenic, it is also necessary to consider the implicated genes in the context of biological networks and pathways. Sets of genes and networks can be places in specific developmental stages and cell types to generate more precise understanding their effects on brain regions and circuits. Clinical architecture – the “structure” of the interrelationships between psychiatric syndromes – is subsequently refined by increased knowledge at each of these levels.
Figure 2:
Figure 2:
Prevalence and impact of psychiatric disorders compared to other major diseases. Looking at both measures allows evaluation of both how common and how impactful a psychiatric disorder is. These data are from global surveys, and we have included other major classes of disease. Prevalence (X-axis) and disability-adjusted life years (DALYs, Y-axis) for ten major classes of disorders. DALYs are a measure of overall disease burden due to the number of years lost due to poor health, disability, or premature mortality, here expressed as the proportion of total global DALYs. Psychiatric disorders rank fifth and accounted for 6.7% (females are the open diamond and males the closed diamond) (Global Burden of Disease Collaborative Network, 2017).
Figure 3:
Figure 3:
(a) Overview of common variant gene discovery for the psychiatric disorders in Table 1. Sources and label definitions are in Table 1. The X-axis is the log10 of the number of cases in the largest current GWAS. The Y-axis is the number of genome-wide significant and LD-independent loci. The color of each point reflects twin-heritability per the scale on the right. For BIP, MDD, and SCZ, the graph includes published and in preparation/in press results (connected by a line). Sample size is the major determinant of discovery. We thank PGC colleagues for allowing us to present pre-publication results. (b) Density plot of genetic risk scores (GRS) in 4,932 SCZ cases (red) and 6,210 controls (blue) from Sweden (training set is from the PGC 2014 SCZ paper excluding Swedish samples) (Schizophrenia Working Group of the Psychiatric Genomics Consortium, 2014). The X-axis shows the standardized GRS and the Y-axis shows the smoothed density, a prediction of the proportion of cases or controls with a given GRS value. The dashed vertical lines show the means of each group. The group means differ by over ⅔ of a standard deviation (0.686), and are highly significantly different (P=1.1e-254, controlling for genotyping array and 5 ancestry PCs). The two curves overlap substantially but there are 48 controls with GRS > 2 and 24 cases with GRS < −2. (c) Depiction of GRS described in Figure 3c but showing the proportions of cases (red) and controls (blue) in each SCZ GRS decile (Y-axis, 1=lowest 10%, 10=highest 10% GRS). X-axis is the proportion within each decile. The proportions of cases increase steadily from lowest to highest. However, there are substantial numbers of cases in the lowest decile and controls in the highest decile.
Figure 3:
Figure 3:
(a) Overview of common variant gene discovery for the psychiatric disorders in Table 1. Sources and label definitions are in Table 1. The X-axis is the log10 of the number of cases in the largest current GWAS. The Y-axis is the number of genome-wide significant and LD-independent loci. The color of each point reflects twin-heritability per the scale on the right. For BIP, MDD, and SCZ, the graph includes published and in preparation/in press results (connected by a line). Sample size is the major determinant of discovery. We thank PGC colleagues for allowing us to present pre-publication results. (b) Density plot of genetic risk scores (GRS) in 4,932 SCZ cases (red) and 6,210 controls (blue) from Sweden (training set is from the PGC 2014 SCZ paper excluding Swedish samples) (Schizophrenia Working Group of the Psychiatric Genomics Consortium, 2014). The X-axis shows the standardized GRS and the Y-axis shows the smoothed density, a prediction of the proportion of cases or controls with a given GRS value. The dashed vertical lines show the means of each group. The group means differ by over ⅔ of a standard deviation (0.686), and are highly significantly different (P=1.1e-254, controlling for genotyping array and 5 ancestry PCs). The two curves overlap substantially but there are 48 controls with GRS > 2 and 24 cases with GRS < −2. (c) Depiction of GRS described in Figure 3c but showing the proportions of cases (red) and controls (blue) in each SCZ GRS decile (Y-axis, 1=lowest 10%, 10=highest 10% GRS). X-axis is the proportion within each decile. The proportions of cases increase steadily from lowest to highest. However, there are substantial numbers of cases in the lowest decile and controls in the highest decile.
Figure 4:
Figure 4:. Establishing the functional and cellular architectures based on genetic findings.
To begin, genetic analyses identify highly confident associations with one or more psychiatric disorders. Common variation is usually detected using GWAS and SNP array technologies. Rare variation capitalizes on CNVs or resequencing via WES or WGS. Some causal variants alter protein structure or function and thereby directly point at specific genes. However, most genetic variation discovered to date is in non-coding regions which can have highly diverse regulatory functions (e.g., enhancer or repressor activity or regulation of splicing or alternative promotor usage). Assigning non-coding regulatory variants to genes is imprecise as gene regulation often occurs at a distance and does not necessarily involve the nearest gene. Instead, one can identify candidate target genes impacted by non-coding disease associated genetic variation using a range of functional genomic data. For example, quantitative mapping approaches can identify how a particular variant effects open chromatin, histone tail modifications, gene expression, splicing, and DNA methylation. These methods integrate DNA-based genetic variation with multi-level “omic” data – RNA sequencing (eQTL or sQTL), methylation analysis (mQTL), or ChIP-seq (hQTL) – to identify the quantitative impact of genetic variation on these molecular phenotypes. Other biochemical methods identify active/open chromatin (ATAC-seq. DNase-seq) or 3D chromatin structures such as enhancer-promotor loops (Hi-C, ChIA-PET), which provide additional information on the relationship between regulatory regions and specific genes with which they interact. Many functional genomic readouts are tissue-specific highlighting the need for comprehensive studies of the human brain across development. When combined, these methods can identify the likely functional impact of disease associated variation on specific genes, which can then be experimentally validated. Molecular pathways can be identified using pathway or gene network analysis. Sets of disease-associated candidate genes can be tested for cell type enrichment to define the cellular architecture. A similar approach applied to identified regulatory regions to define functional regulatory networks or the cell types impacted by disease associated regulatory variation.

References

    1. Abrahams BS, and Geschwind DH (2008). Advances in autism genetics: on the threshold of a new neurobiology. Nat Rev Genet 9, 341–355. - PMC - PubMed
    1. Arnold CD, Gerlach D, Stelzer C, Boryn LM, Rath M, and Stark A (2013). Genome-wide quantitative enhancer activity maps identified by STARR-seq. Science 339, 1074–1077. - PubMed
    1. Barabasi AL, Gulbahce N, and Loscalzo J (2011). Network medicine: a network-based approach to human disease. Nat Rev Genet 12, 56–68. - PMC - PubMed
    1. Berto S, Usui N, Konopka G, and Fogel BL (2016). ELAVL2-regulated transcriptional and splicing networks in human neurons link neurodevelopment and autism. Hum Mol Genet 25, 2451–2464. - PMC - PubMed
    1. Billstedt E, Gillberg IC, and Gillberg C (2007). Autism in adults: symptom patterns and early childhood predictors. Use of the DISCO in a community sample followed from childhood. J Child Psychol Psychiatry 48, 1102–1110. - PubMed

Publication types