Review
. 2019 Mar 21;177(1):85-100.
doi: 10.1016/j.cell.2019.01.033.

Global Genetic Networks and the Genotype-to-Phenotype Relationship

Affiliations
Review

Global Genetic Networks and the Genotype-to-Phenotype Relationship

Michael Costanzo et al. Cell. .

Abstract

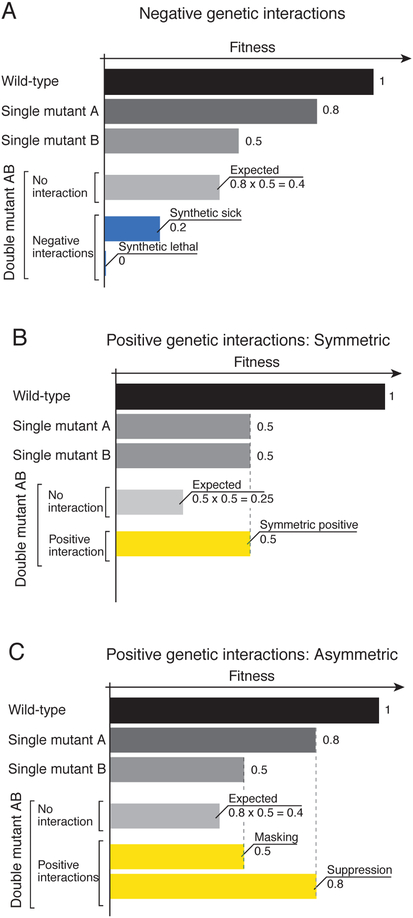
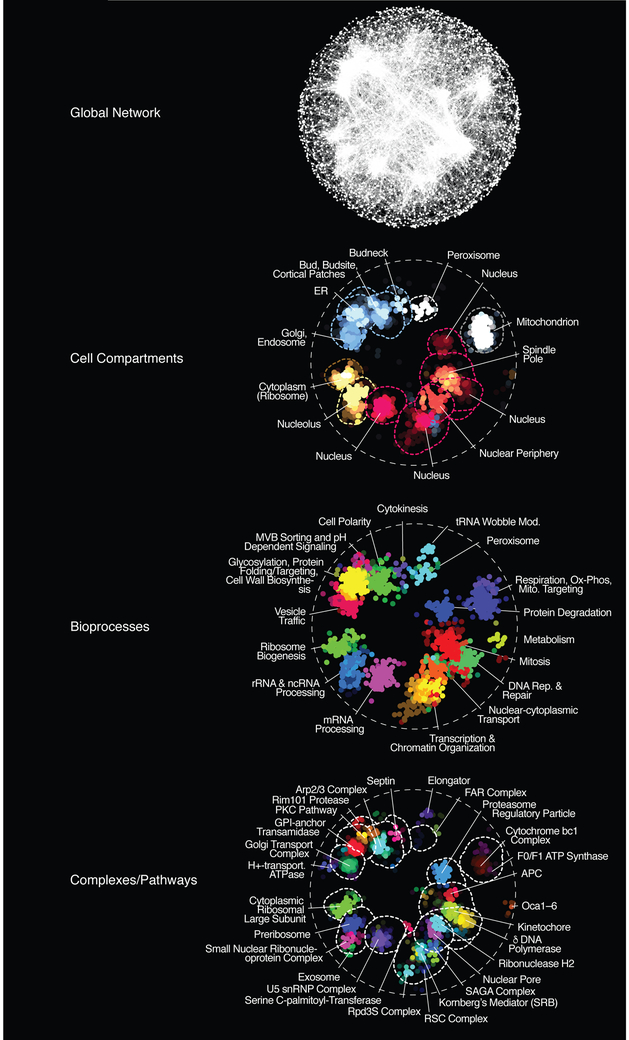
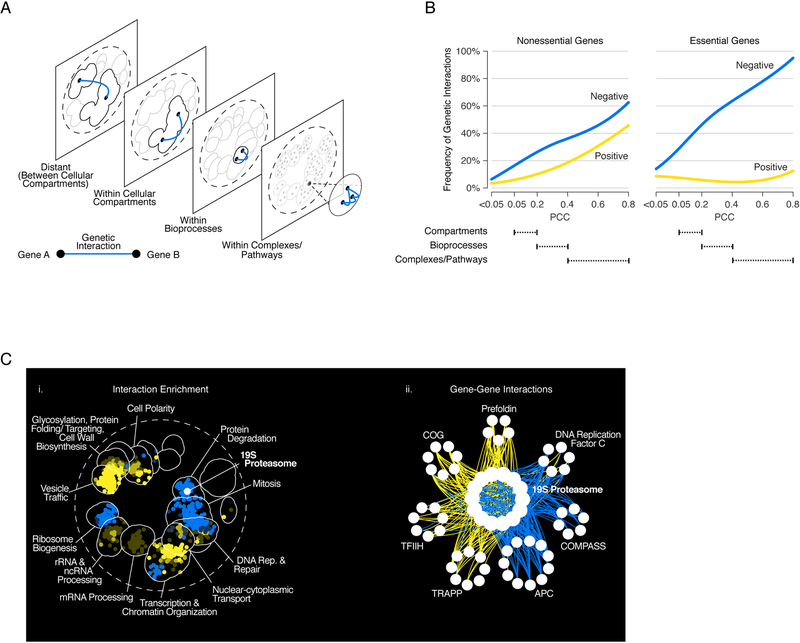
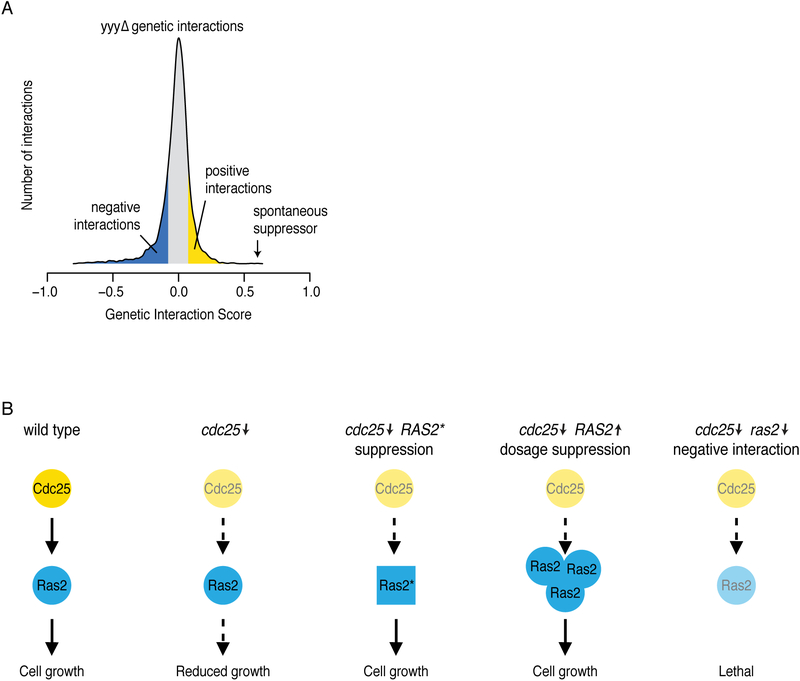
Genetic interactions identify combinations of genetic variants that impinge on phenotype. With whole-genome sequence information available for thousands of individuals within a species, a major outstanding issue concerns the interpretation of allelic combinations of genes underlying inherited traits. In this Review, we discuss how large-scale analyses in model systems have illuminated the general principles and phenotypic impact of genetic interactions. We focus on studies in budding yeast, including the mapping of a global genetic network. We emphasize how information gained from work in yeast translates to other systems, and how a global genetic network not only annotates gene function but also provides new insights into the genotype-to-phenotype relationship.


Figures

Figure 1.
Figure 1.. A graphical representation of quantitative genetic interactions.
Wild type fitness is defined as 1.0 and each single mutant (A and B) exhibits a fitness defect relative to wild-type. (A) Negative genetic interactions. A negative genetic interaction (e.g. synthetic lethal or synthetic sick interaction) occurs if the observed fitness of the double mutant is less than the double mutant fitness expected from a multiplicative model. (B) Symmetric positive interactions. In this specific case, each single mutant (A and B) exhibits a two-fold fitness defect (0.5) relative to wild type (1.0). The fitness of the resultant AB double mutant is greater than expected (0.25) and identical to the fitness of the two single mutants (0.5). Symmetric positive interactions are enriched among members of the same nonessential protein complex. (C) Asymmetric positive interactions. In this case, single mutants and double mutants differ in fitness. Positive interactions that deviate from expectation allow classification into masking or suppression subcategories.
Figure 2.
Figure 2.. A functional map of a yeast cell.
(A) A global genetic profile similarity network encompassing most nonessential and essential genes was constructed by computing Pearson correlation coefficients (PCCs) for genetic interaction profiles of all pairs of genes (nodes). Gene pairs whose profile similarity exceeded a PCC > 0.2 were connected and graphed using a spring-embedded layout algorithm (Smoot et al., 2011). Genes sharing similar genetic interactions profiles map proximal to each other, whereas genes with less similar genetic interaction profiles are positioned further apart. (B-D) The global genetic interaction profile similarity network is organized as a hierarchy of functional modules enriched for specific (B) cellular compartments, (C) biological processes or (D) protein complexes and pathways. Functional annotation of the networks was done using Spatial Analysis of Functional Enrichment (SAFE) (Baryshnikova, 2016). Adapted from (Costanzo et al., 2016).
Figure 3.
Figure 3.. Mapping negative and positive interactions across the genetic network–based functional hierarchy.
(A) Schematic representation of the genetic network–based functional hierarchy illustrating functionally-defined clusters of interactions between genes within the same complex/pathway, bioprocess, or cellular compartment, as well as distant interactions that span two different cellular compartments. (B) The frequency of genetic interactions between genes in the same functional cluster (as defined in (A)), at a given level of profile similarity (PCC) in the genetic network hierarchy for negative (blue) or positive (yellow) genetic interactions. Dashed lines indicate the PCC range within which clusters in the genetic network hierarchy were enriched for cell compartments, bioprocesses, and protein complexes. (C) Functional wiring diagram from the 19S proteasome identifies within pathway modules (WPM) and between pathway models (BPM) of genetic interactions. (i) Regions of the yeast global similarity network significantly enriched for genes exhibiting negative (blue) or positive (yellow) genetic interactions with 19S proteasome genes are shown using SAFE (Baryshnikova, 2016). (ii) Genes belonging to a subset of protein complexes that showed coherent negative (blue) or positive (yellow) genetic interactions with genes encoding the 19S proteasome. Adapted from (Costanzo et al., 2016).
Figure 4.
Figure 4.. Genetic suppression interactions.
(A) Example of a distribution of negative (blue) and positive (yellow) genetic interactions of mutant yyyΔ determined by a genome-wide screen. The genetic interaction score is defined as the difference between the observed and the expected double mutant fitness (see Figure 1). Spontaneous suppressor mutations often represent the most extreme, strong positive genetic interactions, as indicated. (B) An example of a gene pair (CDC25 and RAS2) illustrating suppression, dosage suppression, and negative genetic interactions. Lightly shaded proteins are encoded by partial loss-of-function alleles with reduced signaling activity, Ras2* is encoded by a gain-of-function allele with increased signaling activity. Adapted from (van Leeuwen et al., 2016).
Figure 5.
Figure 5.. Strategies for mapping genetic interactions in human cells.
(A) A genome-scale gene editing approach (e.g using CRISPR-Cas9 and genome-wide gRNA library) to identify essential genes in a cancer cell-specific manner. Different cancer cell lines are represented by coloured nuclei. Additional genomic analysis is required to identify secondary mutations that interact with a particular gene required for viability across subsets of cancer cell lines. (B) Large-scale CRISPR-Cas9 screens to systematically introduce a second, defined mutation, presented by nuclei with different shades of grey, into a set of isogenic cell lines, each carrying a stable mutation in a specific query gene of interest. Genes that result in a fitness defect when targeted in a particular query mutant cell line identify potential genetic interactions. (C) A combinatorial approach enabling perturbation of two different genes, simultaneously within a specific cell line, to identify pairs of genes that, when mutated in the same cell, result in an unexpected growth phenotype. (D) Computational analysis of large-scale human genotype data that leverages pathway/functional module information as prior knowledge to aggregate genetic variants to discover pairs of pathways/functional modules that result in increased or decreased disease risk when both mutated in defined group of individuals, such as disease cohort (blue people), when compared to a control group, such as unaffected individuals (red people). Filled circles represent genes annotated to a particular pathway (modified from (Wang et al., 2017b)).

References

    1. Agarwala A, and Fisher DS (2018). Adaptive walks on high-dimensional fitness landscapes and seascapes with distance-dependent statistics. bioRxiv. - PubMed
    1. Aly A, and Ganesan S (2011). BRCA1, PARP, and 53BP1: conditional synthetic lethality and synthetic viability. J Mol Cell Biol 3, 66–74. - PMC - PubMed
    1. Ashworth A, and Lord CJ (2018). Synthetic lethal therapies for cancer: what’s next after PARP inhibitors? Nature Reviews Clinical Oncology 15, 564–576. - PubMed
    1. Bandyopadhyay S, Kelley R, Krogan NJ, and Ideker T (2008). Functional maps of protein complexes from quantitative genetic interaction data. PLoS Comput Biol 4, e1000065. - PMC - PubMed
    1. Bandyopadhyay S, Mehta M, Kuo D, Sung MK, Chuang R, Jaehnig EJ, Bodenmiller B, Licon K, Copeland W, Shales M, et al. (2010). Rewiring of genetic networks in response to DNA damage. Science 330, 1385–1389. - PMC - PubMed

Publication types

LinkOut - more resources