. 2019 Mar 21;19(6):1397.
doi: 10.3390/s19061397.

Development and Characterization of Thermal Flow Sensors for Non-Invasive Measurements in HVAC Systems

Affiliations

Development and Characterization of Thermal Flow Sensors for Non-Invasive Measurements in HVAC Systems

Samir Cerimovic et al. Sensors (Basel). .

Abstract

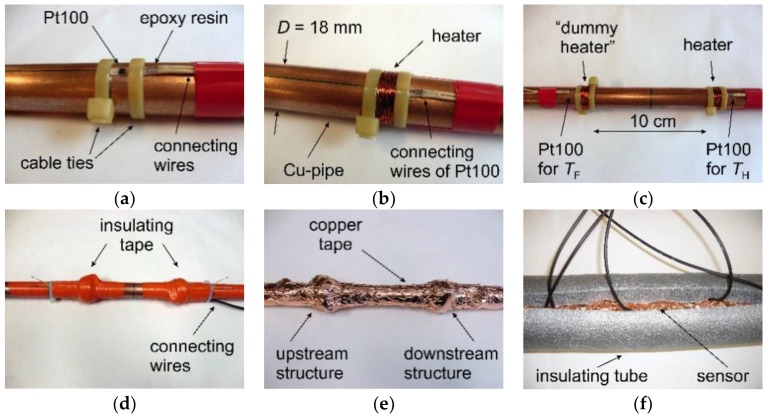
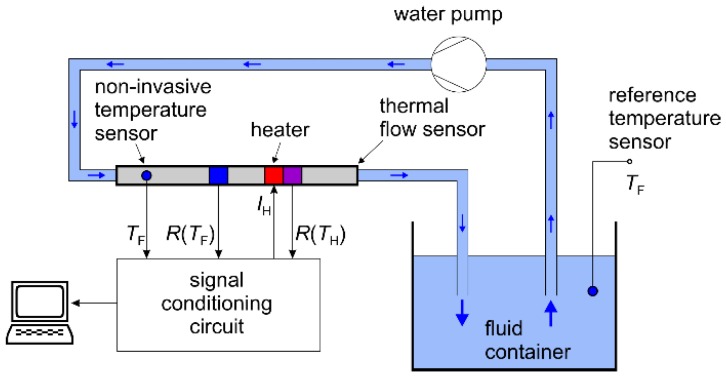
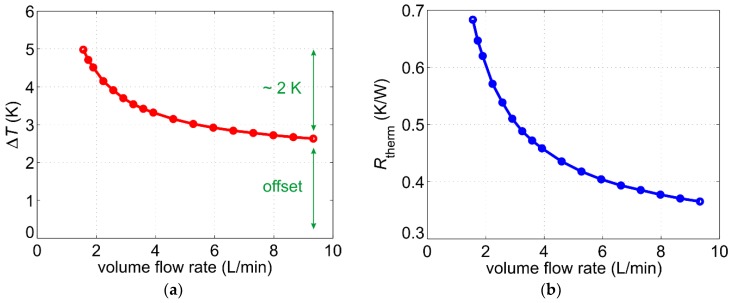
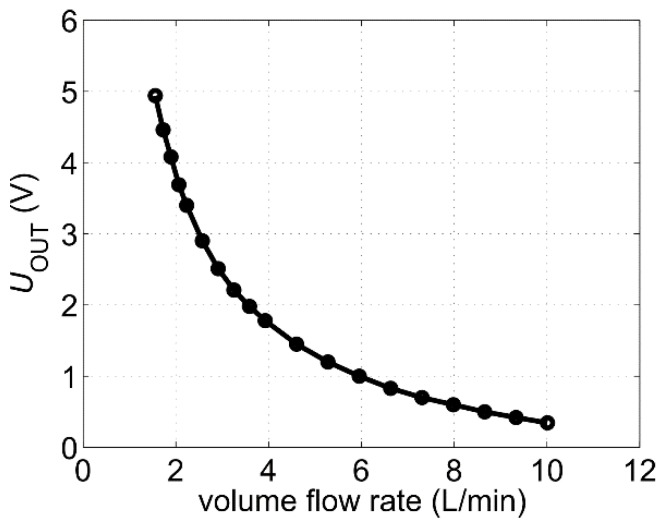
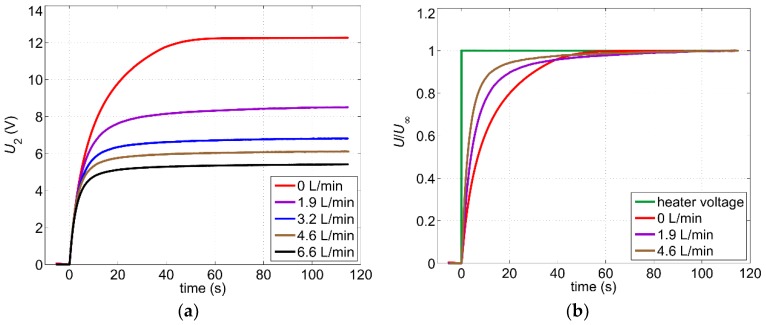
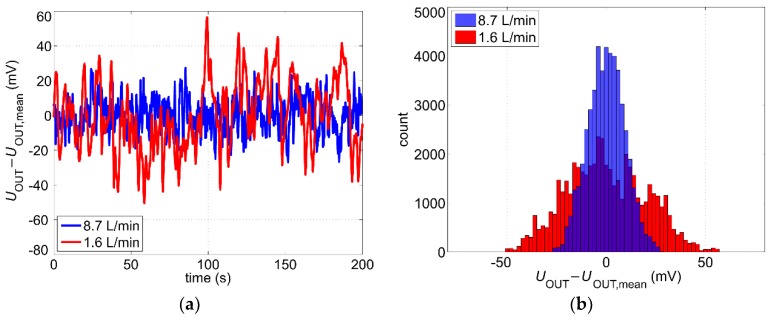
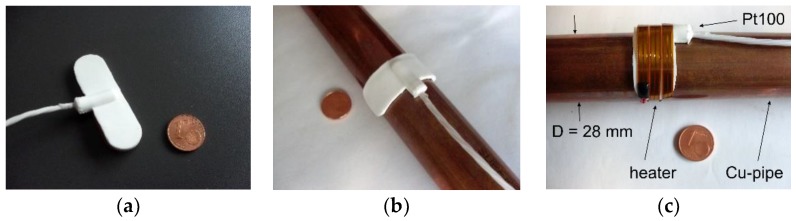
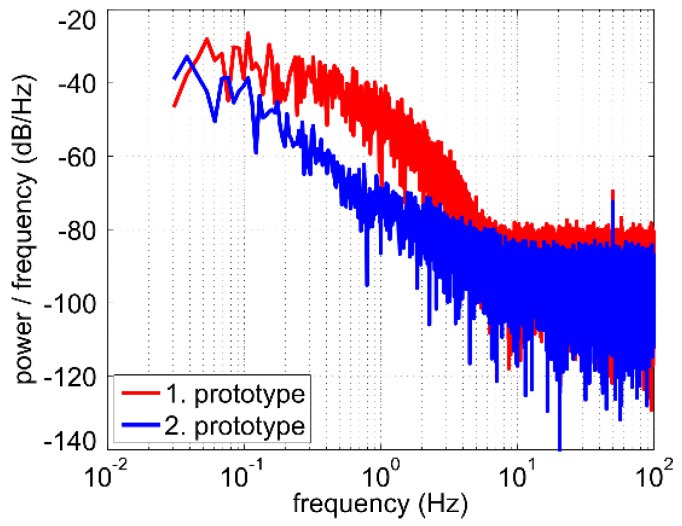
We investigated non-invasive flow rate measurements in heating, ventilation, and air conditioning (HVAC) systems utilizing thermal transduction instead of commonly used ultrasonic techniques. The proposed thermal flow transduction comprises two temperature sensors and a heater, all mounted non-invasively on the outer surface of metal-pipes and, therefore, not disturbing the fluid flow inside. One temperature sensor measures the heater temperature, whereas the other one, mounted upstream of the heater, follows the fluid temperature for reference. The temperature difference (i.e., the heater excess temperature) depends on the fluid flow velocity and can be used to derive the mean volume flow inside the pipe. Experimental characterizations were conducted using two sensor prototypes. Beside output characteristics, other main issues such as dynamic behavior and noise density were investigated in detail. Special attention was paid to error compensation allowing measurements within a large range of fluid temperatures. Measurement results confirm the feasibility of this approach, however with some constraints regarding response time.

Keywords: HVAC systems; non-invasive flow rate measurement; thermal flow sensor.


Conflict of interest statement

The authors declare no conflict of interest. The funders had no role in the design of the study; in the collection, analyses, or interpretation of data; in the writing of the manuscript, or in the decision to publish the results.

Figures

Figure 1
Figure 1
(a) Schematic cross-section of the sensor; (b) Pt100 elements used for the first sensor prototype.
Figure 2
Figure 2
Construction steps of the first sensor prototype: (a) Pt100 element placed and tied on the copper pipe (inner diameter 16 mm, outer diameter 18 mm); (b) Copper winding around the Pt100 temperature sensor serves as a heater; (c) The same structure with a “dummy heater” was placed 10 cm upstream, in order to measure the fluid temperature TF; (d) Both structures were first insulated using electrical insulation tape; (e) Copper tape serves as a further insulation and shielding; (f) The last insulating layer consist of 2 cm thick polyethylene tube.
Figure 3
Figure 3
Schematic diagram of the measurement setup. R(TH) and R(TF) denote Pt100 elements located below and upstream of the heater, respectively. The heater is supplied with a constant electrical current IH. Water temperature TF can be measured with a non-invasive sensor incorporated into the thermal flow sensor as well as with an invasive sensor used for the reference.
Figure 4
Figure 4
(a) Heater excess temperature as a function of the volume flow rate for a constant current supply of 780 mA resulting in a heating power of about 7.2 W; (b) Measured thermal resistance as a function of the volume flow rate.
Figure 5
Figure 5
Schematic diagram of the signal conditioning circuit. R(TH) and R(TF) denote Pt100 elements located below and upstream of the heater, respectively. Adjusting the offset of the second amplifier, the temperature dependence of the output signal can be taken into account. Before being sampled by a microcontroller, the output signal is filtered by a 3rd order low pass filter with a cutoff frequency of 2 Hz.
Figure 6
Figure 6
Output characteristic of the first sensor prototype. The following parameters have been chosen in the measurement: A1 = 1000, A2 = 6.3, IH = 730 mA, water temperature was around the reference value of 25 °C, offset1 ≈ 730 mV while the offset of the second amplifier was switched off.
Figure 7
Figure 7
(a) Transients of the output signal for different volume flow rates in response to switching on the heater power; (b) Corresponding normalized transients. U denotes the steady-state value reached after approx. 2 min. Measurements were conducted with a digital oscilloscope using averaging mode to suppress noise effects.
Figure 8
Figure 8
(a) Transient response of the output signal after a step-like change of the fluid temperature at a constant volume flow rate of 4.6 L/min; (b) Transient response of the output signal after step-like changes of the volume flow rate (flow step 1: from 8.7 L/min to 4.9 L/min, flow step 2: from 4.6 L/min to 1.9 L/min). U0 and U denote the initial and the final value, respectively.
Figure 9
Figure 9
Oscillograms (a) and the corresponding histograms (b) of the zero-mean output voltage UOUTUOUT,mean for two different volume flow rates.
Figure 10
Figure 10
(a) Standard deviation σV˙=σU/S as a function of the volume flow rate; (b) Estimation of the maximum relative error (Equation (6)) as a function of the Reynolds number.
Figure 11
Figure 11
(a) Power spectral density estimates (periodograms) of the output voltage UOUT for two different volume flow rates. H(jf) denotes the transfer function of the applied third-order low-pass filter; (b) Periodogram of the output voltage for zero flow with and without the heating.
Figure 12
Figure 12
Difference between output voltage UOUT (measured at fluid temperature TF) and the reference value UOUT,ref (measured at reference fluid temperature Tref = 25 °C) as a function of temperature difference TFTref. In the measurement, TF was varied from 10 °C to 50 °C and then back to 10 °C for three constant volume flow rates (1.9 L/min, 4.6 L/min, and 8.7 L/min).
Figure 13
Figure 13
(a) Measured fluid temperature during long-term measurement with continues heating and constant flow rate of V˙set=1.9 L/min; (b) Corresponding relative error (Equation (7)).
Figure 14
Figure 14
(a) Measured fluid temperature during long-term measurements with intermittent heating and constant flow rate of V˙set=4.6 L/min; (b) Corresponding relative error (Equation (7)).
Figure 15
Figure 15
(a) Pt100 elements used for the second sensor prototype; (b) Pt100 element affixed on the surface of a copper pipe (inner diameter 26 mm, outer diameter 28 mm); (c) Self-adhesive heater stripe wound around the Pt100 temperature sensor.
Figure 16
Figure 16
(a) Thermal resistance of both sensor prototypes as a function of the mean flow velocity; (b) Comparison of the output characteristics. The following parameters have been chosen for the second prototype: A1 = 1000, A2 = 12.5, IH = 780 mA, TF ≈ 25 °C, offset1 ≈ 2840 mV while the offset of the second amplifier was switched off. In contrast, the parameters of the first prototype are summarized in Figure 6.
Figure 17
Figure 17
Comparison of the normalized transients of the output signal in response to switching on the heater power. U denotes the steady-state value. For both sensor prototypes, the same constant mean flow velocity of about 0.27 m/s was adjusted.
Figure 18
Figure 18
(a) Transient response of the output signal of the second sensor prototype after a step-like change of the fluid temperature at a constant volume flow rate of 9.3 L/min; (b) Comparison of transient responses after step-like changes of the mean flow velocity (flow step from 0.27 m/s to 0.17 m/s). U0 and U denote the initial and the final value, respectively.
Figure 19
Figure 19
Power spectral density estimates (periodograms) of the output voltage UOUT at a constant Reynolds number of Re ≈ 8000 for both sensor.
Figure 20
Figure 20
(a) Comparison of the standard deviation σV˙=σU/S as a function of the volume flow rate; (b) Comparison of the maximum relative error (estimation according to Equation (6)) as a function of the Reynolds number.

References

    1. Allouhi A., El Fouih Y., Kousksou T., Jamil A., Zeraouli Y., Mourad Y. Energy consumption and efficiency in buildings: Current status and future trends. J. Clean. Prod. 2015;109:118–130. doi: 10.1016/j.jclepro.2015.05.139. - DOI
    1. Cao X., Dai X., Liu J. Building energy-consumption status worldwide and the state-of-art technologies for zero-energy buildings during the past decade. Energy Build. 2016;128:198–213. doi: 10.1016/j.enbuild.2016.06.089. - DOI
    1. Treado S., Chen Y. Saving Building Energy through Advanced Control Strategies. Energies. 2013;6:4769–4785. doi: 10.3390/en6094769. - DOI
    1. Elwenspoek M. Thermal flow micro sensors; Proceedings of the International Semiconductor Conference; Sinaia, Romania. 5–9 October 1999; pp. 423–435. - DOI
    1. Nguyen N.T. Micromachined flow sensors―A review. Flow Meas. Instrum. 1997;8:7–16. doi: 10.1016/S0955-5986(97)00019-8. - DOI

LinkOut - more resources