. 2019 Mar 21;11(3):398.
doi: 10.3390/cancers11030398.

The Delta Subunit of Rod-Specific Photoreceptor cGMP Phosphodiesterase (PDE6D) Contributes to Hepatocellular Carcinoma Progression

Affiliations

The Delta Subunit of Rod-Specific Photoreceptor cGMP Phosphodiesterase (PDE6D) Contributes to Hepatocellular Carcinoma Progression

Peter Dietrich et al. Cancers (Basel). .

Abstract

Emerging evidence reveals crucial roles of wild type RAS in liver cancer. The delta subunit of rod-specific photoreceptor cGMP phosphodiesterase (PDE6D) regulates the trafficking of RAS proteins to the plasma membrane and thereby contributes to RAS activation. However, the expression and specific function of PDE6D in hepatocellular carcinoma (HCC) were completely unknown. In this study, PDE6D was newly found to be markedly upregulated in HCC tissues and cell lines. Overexpression of PDE6D in HCC correlated with enhanced tumor stages, tumor grading, and ERK activation. PDE6D depletion significantly reduced proliferation, clonogenicity, and migration of HCC cells. Moreover, PDE6D was induced by TGF-β1, the mediator of stemness, epithelial-mesenchymal transition (EMT), and chemoresistance. In non-resistant cells, overexpression of PDE6D conferred resistance to sorafenib-induced toxicity. Further, PDE6D was overexpressed in sorafenib resistance, and inhibition of PDE6D reduced proliferation and migration in sorafenib-resistant HCC cells. Together, PDE6D was found to be overexpressed in liver cancer and correlated with tumor stages, grading, and ERK activation. Moreover, PDE6D contributed to migration, proliferation, and sorafenib resistance in HCC cells, therefore representing a potential novel therapeutic target.

Keywords: HCC; KRAS; PDE6D; TGF-β; sorafenib.


Conflict of interest statement

The authors declare no conflict of interest.

Figures

Figure 1
Figure 1
In silico analysis of rod-specific photoreceptor cGMP phosphodiesterase (PDE6D) expression in hepatocellular carcinoma (HCC). (A) OncomineTM human cancer microarray database analysis of six patient datasets depicting PDE6D mRNA expression levels in HCCs and non-tumorous livers (* p < 0.05 vs. non-tumorous livers). (B,C) OncomineTM human cancer microarray database analysis of PDE6D expression as detected in large-scale RNA profiling studies comparing diverse carcinomas of different origins (* p < 0.05 vs. average expression).
Figure 2
Figure 2
PDE6D expression in HCC in vivo and in vitro. (A) PDE6D mRNA levels as quantified by qRT-PCR analysis of HCC patient samples and paired non-tumorous liver tissues (* p < 0.05). (B) Detection of PDE6D mRNA in human HCC cells (PLC, Hep3B, HepG2) after qRT-PCR amplification using gel electrophoresis (left panel) and relative PDE6D mRNA levels (qRT-PCR) in human HCC cell lines (PLC, Hep3B, HepG2) compared with primary human hepatocytes derived from different donors (#1–3) (right panel) (* p < 0.05 vs. hepatocytes). (C) Exemplary Western blot image (left panel) and summarized densitometric quantification (right panel) of PDE6D protein levels in HCC cells (PLC, Hep3B, HepG2, Huh-7) compared with hepatocytes derived from different donors (#1–2) (* p < 0.05 vs. hepatocytes).
Figure 3
Figure 3
Effects of PDE6D knockdown on HCC proliferation and clonogenicity. Prior to functional experiments, HCC cell lines (PLC, Hep3B) were transfected with si-RNA-pools against PDE6D (“PDE6D”) or the according control-si-RNA-pool (“Control”). (A) PDE6D mRNA levels as quantified by qRT-PCR analysis (* p < 0.05 vs. control). (B) PDE6D protein levels as quantified by Western blot analysis. The left panel depicts an exemplary Western blot image, and the right panel depicts the summarized densitometric quantification (* p < 0.05 vs. control). (C) Real-time cell proliferation (xCELLigence). Exemplary proliferation curves (left panel) and quantified “slopes” (summarizing the proliferative ability) (right panel) are shown (* p < 0.05 vs. control). (D) Relative (to mean) PDE6D as correlated to CyclinD1 mRNA expression levels (qRT-PCR) in human HCC patient tissue samples. (E,F) Anchorage-dependent clonogenic assay (an exemplary image (Hep3B) is depicted in the left panel of (E)). Quantification of colony number (right panel of (E)) and sizes (F) (* p < 0.05).
Figure 4
Figure 4
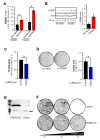
Expression and function of PDE6D in sorafenib resistance. (A) PDE6D mRNA levels as quantified by qRT-PCR analysis in non-resistant (“non-resist.”) as compared to sorafenib-resistant (“resistant”) Hep3B and HepG2 cell clones (* p < 0.05). (B) Exemplary image (left panel) and summarized densitometric quantification (right panel) of Western blot analysis of PDE6D levels in non-resistant (“non-resist.”) as compared to sorafenib-resistant (“resistant”) Hep3B cells (rel DM: relative (PDE6D/Actin) densitometry) (* p < 0.05 vs. non-resist.). (C,D) Prior to functional experiments, resistant cells (Hep3B) were transfected with si-RNA-pools against PDE6D (“PDE6D”) or the according control-si-RNA-pool (“Control”). (C) Depicts relative proliferation (cell numbers) and (D) depicts exemplary clonogenic assays. (E,F) Forced overexpression of PDE6D protein (PDE6D-OE) in HCC cells (e.g., PLC) was performed by transfection of a human PDE6D open reading frame (ORF) Myc-DDK-tagged plasmid vector (an empty control vector without the PDE6D ORF was used as control treatment). (E) Depicts Western blot analysis depicting the overexpressed Myc-DDK-tagged PDE6D protein after PDE6D-OE as well as endogenous (arrow) PDE6D in both PDE6D-OE and control-treated cells. (F) Depicts exemplary images (representing 8 replicate values of 2 independent experiments) of cells cultured in 6-wells for 72 h (100,000 cells were initially seeded per 6-well) and treated with different doses of sorafenib (0, 4, 8 µM).
Figure 5
Figure 5
TGF-â-mediated regulation of PDE6D and the effect of PDE6D on HCC cell migration. (AC) Quantitative RT-PCR analysis of VIMENTIN, SNAIL, S100A4 (A) and KRAS (B) mRNA levels in HCC cells (PLC) that were stimulated with different doses of recombinant human TGF-â1 protein for 72–96 hours (* p < 0.05 vs. control). (C,D) Quantitative RT-PCR revealing mRNA levels (C) as well as protein levels as quantified by Western blot analysis (including a representative Western blot image) (the densitometric values represent two independent Western blot analysis) (D) of PDE6D expression in HCC cells (PLC) that were treated with different doses of recombinant human TGF-â1 for 72–96 hours. (D) also depicts co-treatment with 15 µM of the TGF-â-receptor-1 (TGFBR1) inhibitor LY2157299 (“galunisertib”) (* p < 0.05 vs. control). (E,F) Prior to Boyden chamber experiments, non-resistant HCC cells (PLC, Hep3B) (E) and sorafenib-resistant Hep3B cells (F) were transfected with si-RNA-pools against PDE6D (“PDE6D”) or the according control-si-RNA-pool (“Control”). Migration (migrating cells per visual field) as measured by Boyden chamber migration assay (duration of migration: 4 hours) is depicted as absolute cell counts (E) or as normalized migration (F) (* p < 0.05).
Figure 6
Figure 6
Expression and cellular localization of PDE6D in HCC in vivo and in vitro. (A) PDE6D staining (exemplary images) of non-tumorous liver tissues (left side) and HCC tissues (right side) deposited on the Human Protein Atlas database. (B) Tissue microarray analysis of PDE6D expression levels in human HCC tissues (N = 117) as compared with corresponding non-tumorous liver tissues (N = 127) (Fisher’s exact P < 0.001). (C,D) Tissue microarray analysis of PDE6D expression levels in human HCC tissues correlated with tumor grading (Fisher’s exact P = 0.030) (C) and tumor stages (D). (E) Exemplary immunohistological images of PDE6D protein expression in human HCC samples and corresponding non-tumorous liver tissues applying a tissue microarray revealing nuclear staining next to cytoplasmatic staining patterns (paired samples of two different patients (#1, #2) are depicted). (F,G) Tissue microarray analysis comparing tumor stages (F) and ERK activation (p-ERK) (G) in human HCC tissues with (“yes”) and without (“no”) cytoplasmatic localization pattern of PDE6D. (H) In silico-based analysis of importin-á-dependent nuclear localization signals (NLS, red letters) using the “cNLS Mapper” predicted bipartite NLS in both isoforms of PDE6D (score for both isoforms was 5.3). A legend depicts that higher scores indicate stronger NLS activity and defines major localizations in dependence of each score. (I,J) Exemplary immunofluorescence (I) and Western blot analysis (J) depicting nuclear localization of PDE6D (I) and expression of PDE6D in both nuclear and cytoplasmatic fractions (J) of HCC cell lysates.

References

    1. Dietrich P., Hellerbrand C. Non-alcoholic fatty liver disease, obesity and the metabolic syndrome. Best Pr. Res. Clin. Gastroenterol. 2014;28:637–653. doi: 10.1016/j.bpg.2014.07.008. - DOI - PubMed
    1. Aravalli R.N., Steer C.J., Cressman E.N. Molecular mechanisms of hepatocellular carcinoma. Hepatology. 2008;48:2047–2063. doi: 10.1002/hep.22580. - DOI - PubMed
    1. Pascual S., Herrera I., Irurzun J. New advances in hepatocellular carcinoma. World J. Hepatol. 2016;8:421–438. doi: 10.4254/wjh.v8.i9.421. - DOI - PMC - PubMed
    1. Ostrem J.M., Shokat K.M. Direct small-molecule inhibitors of KRAS: From structural insights to mechanism-based design. Nat. Rev. Drug. Discov. 2016;15:771–785. doi: 10.1038/nrd.2016.139. - DOI - PubMed
    1. Nishida N., Kitano M., Sakurai T., Kudo M. Molecular Mechanism and Prediction of Sorafenib Chemoresistance in Human Hepatocellular Carcinoma. Dig. Dis. 2015;33:771–779. doi: 10.1159/000439102. - DOI - PubMed

LinkOut - more resources