

EmptyDrops: distinguishing cells from empty droplets in droplet-based single-cell RNA sequencing data
- PMID: 30902100
- PMCID: PMC6431044
- DOI: 10.1186/s13059-019-1662-y
EmptyDrops: distinguishing cells from empty droplets in droplet-based single-cell RNA sequencing data
Abstract
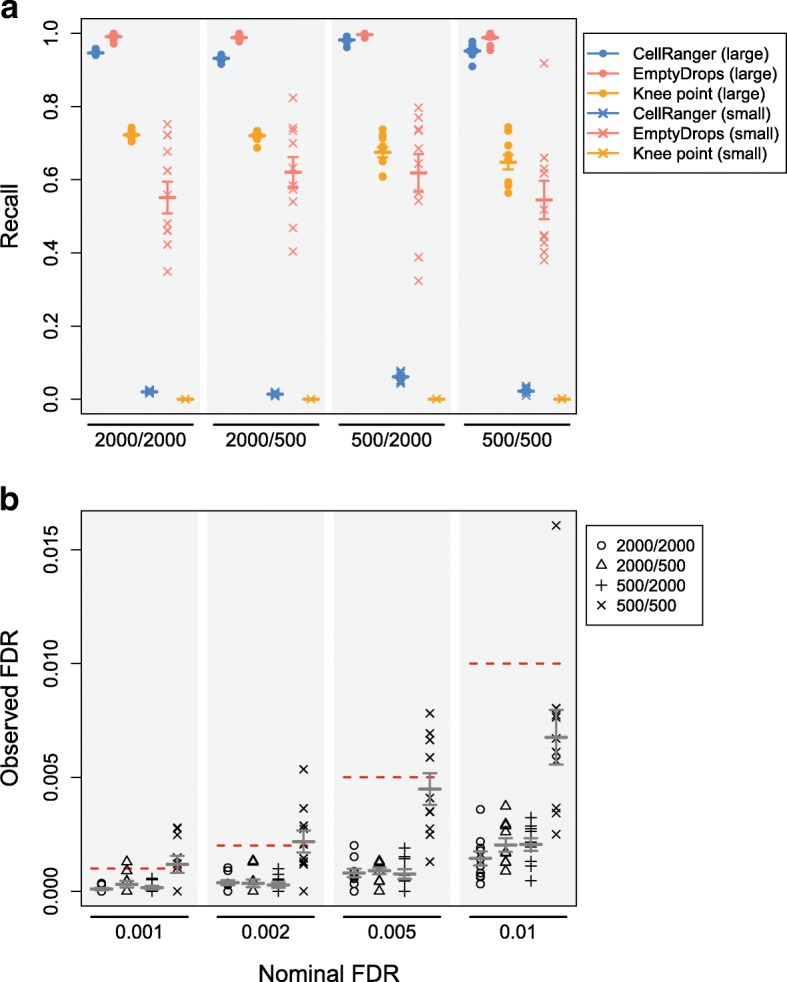
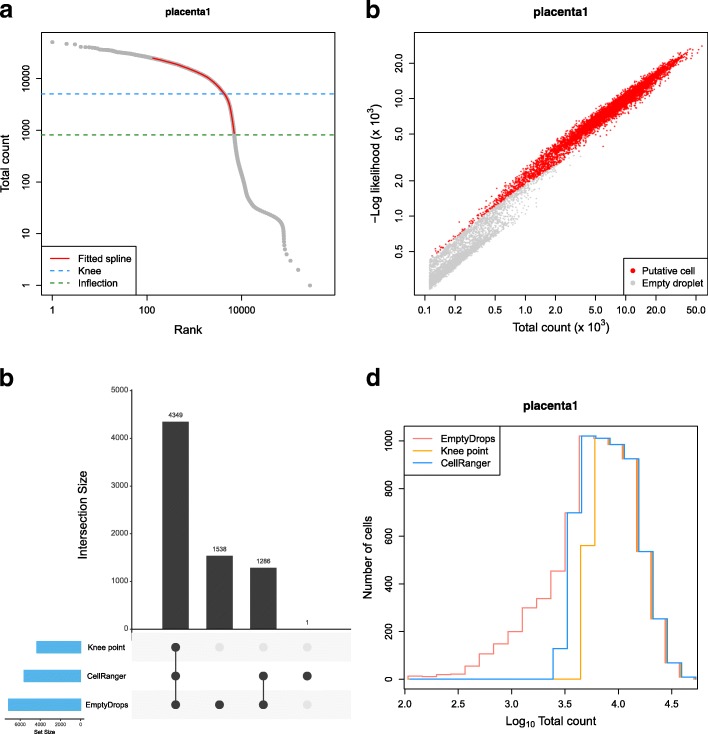
Droplet-based single-cell RNA sequencing protocols have dramatically increased the throughput of single-cell transcriptomics studies. A key computational challenge when processing these data is to distinguish libraries for real cells from empty droplets. Here, we describe a new statistical method for calling cells from droplet-based data, based on detecting significant deviations from the expression profile of the ambient solution. Using simulations, we demonstrate that EmptyDrops has greater power than existing approaches while controlling the false discovery rate among detected cells. Our method also retains distinct cell types that would have been discarded by existing methods in several real data sets.
Keywords: Cell detection; Droplet-based protocols; Empty droplets; Single-cell transcriptomics.
Conflict of interest statement
Ethics approval and consent to participate
Not applicable.
Competing interests
The authors declare that they have no competing interests.
Publisher’s Note
Springer Nature remains neutral with regard to jurisdictional claims in published maps and institutional affiliations.
Figures

Similar articles
-
DropletQC: improved identification of empty droplets and damaged cells in single-cell RNA-seq data.Genome Biol. 2021 Dec 2;22(1):329. doi: 10.1186/s13059-021-02547-0. Genome Biol. 2021. PMID: 34857027 Free PMC article.
-
Scalable microfluidics for single-cell RNA printing and sequencing.Genome Biol. 2015 Jun 6;16(1):120. doi: 10.1186/s13059-015-0684-3. Genome Biol. 2015. PMID: 26047807 Free PMC article.
-
Automated quality control and cell identification of droplet-based single-cell data using dropkick.Genome Res. 2021 Oct;31(10):1742-1752. doi: 10.1101/gr.271908.120. Epub 2021 Apr 9. Genome Res. 2021. PMID: 33837131 Free PMC article.
-
Droplet-based single-cell sequencing: Strategies and applications.Biotechnol Adv. 2024 Dec;77:108454. doi: 10.1016/j.biotechadv.2024.108454. Epub 2024 Sep 11. Biotechnol Adv. 2024. PMID: 39271031 Review.
-
Droplet microfluidics--a tool for single-cell analysis.Angew Chem Int Ed Engl. 2012 Dec 3;51(49):12176-92. doi: 10.1002/anie.201200460. Epub 2012 Nov 23. Angew Chem Int Ed Engl. 2012. PMID: 23180509 Review.
Cited by
-
Novel Technologies in Studying Brain Immune Response.Oxid Med Cell Longev. 2021 Mar 18;2021:6694566. doi: 10.1155/2021/6694566. eCollection 2021. Oxid Med Cell Longev. 2021. PMID: 33791073 Free PMC article. Review.
-
Single-cell RNA sequencing identifies shared differentiation paths of mouse thymic innate T cells.Nat Commun. 2020 Aug 31;11(1):4367. doi: 10.1038/s41467-020-18155-8. Nat Commun. 2020. PMID: 32868763 Free PMC article.
-
Vascular deficiencies in renal organoids and ex vivo kidney organogenesis.Dev Biol. 2021 Sep;477:98-116. doi: 10.1016/j.ydbio.2021.04.009. Epub 2021 May 15. Dev Biol. 2021. PMID: 34000274 Free PMC article.
-
Age-associated changes in lineage composition of the enteric nervous system regulate gut health and disease.Elife. 2023 Dec 18;12:RP88051. doi: 10.7554/eLife.88051. Elife. 2023. PMID: 38108810 Free PMC article.
-
Altered microbial bile acid metabolism exacerbates T cell-driven inflammation during graft-versus-host disease.Nat Microbiol. 2024 Mar;9(3):614-630. doi: 10.1038/s41564-024-01617-w. Epub 2024 Mar 1. Nat Microbiol. 2024. PMID: 38429422 Free PMC article.
References
-
- Macosko EZ, Basu A, Satija R, Nemesh J, Shekhar K, Goldman M, Tirosh I, Bialas AR, Kamitaki N, Martersteck EM, Trombetta JJ, Weitz DA, Sanes JR, Shalek AK, Regev A, McCarroll SA. Highly parallel genome-wide expression profiling of individual cells using nanoliter droplets. Cell. 2015;161(5):1202–14. doi: 10.1016/j.cell.2015.05.002. - DOI - PMC - PubMed
-
- Zheng GX, Terry JM, Belgrader P, Ryvkin P, Bent ZW, Wilson R, Ziraldo SB, Wheeler TD, McDermott GP, Zhu J, Gregory MT, Shuga J, Montesclaros L, Underwood JG, Masquelier DA, Nishimura SY, Schnall-Levin M, Wyatt PW, Hindson CM, Bharadwaj R, Wong A, Ness KD, Beppu LW, Deeg HJ, McFarland C, Loeb KR, Valente WJ, Ericson NG, Stevens EA, Radich JP, Mikkelsen TS, Hindson BJ, Bielas JH. Massively parallel digital transcriptional profiling of single cells. Nat Commun. 2017;8:14049. doi: 10.1038/ncomms14049. - DOI - PMC - PubMed
Publication types
MeSH terms
Substances
Grants and funding
LinkOut - more resources
Full Text Sources
Other Literature Sources
