. 2019 May:23:75-81.
doi: 10.1016/j.molmet.2019.02.011. Epub 2019 Mar 7.

Pirt deficiency has subtle female-specific effects on energy and glucose metabolism in mice

Affiliations

Pirt deficiency has subtle female-specific effects on energy and glucose metabolism in mice

Sigrid Jall et al. Mol Metab. 2019 May.

Erratum in

Abstract

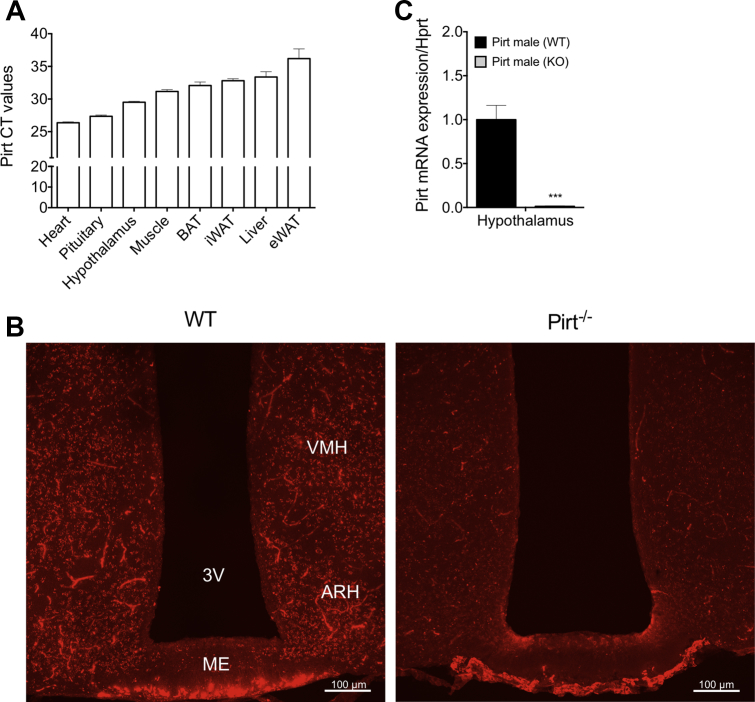
Objective: The contribution of brown adipose tissue (BAT) to adult human metabolic control is a topic of ongoing investigation. In context, understanding the cellular events leading to BAT uncoupling, heat production, and energy expenditure is anticipated to produce significant insight into this endeavor. The phosphoinositide interacting regulator of transient receptor potentials (Pirt) was recently put forward as a key protein regulating cold sensing downstream of the transient receptor potential melastatin 8 (TRPM8). Notably, TRPM8 has been identified as a non-canonical regulator of BAT thermogenesis. The aim of this investigation was to delineate the role of Pirt in energy homeostasis and glucose metabolism - and the possible involvement of Pirt in TRPM8-elicited energy expenditure.

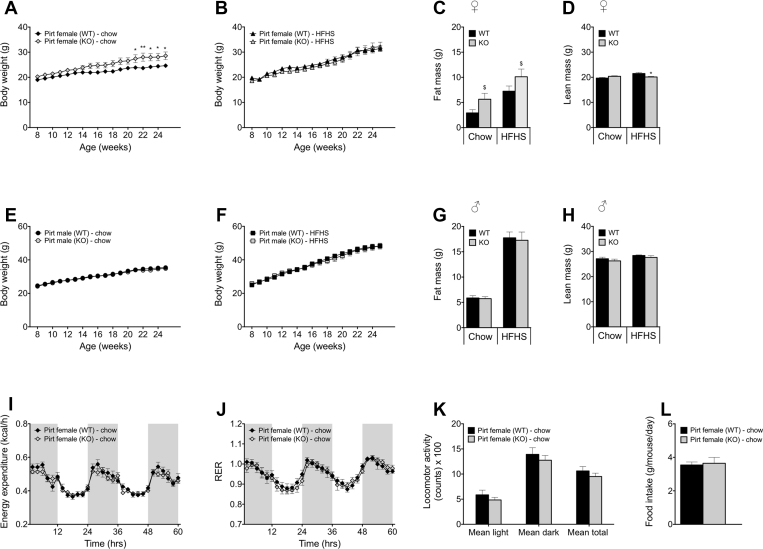
Methods: To this end, we metabolically phenotyped male and female Pirt deficient (Pirt-/-) mice exposed to a low-fat chow diet or to a high-fat, high-sugar (HFHS) diet.

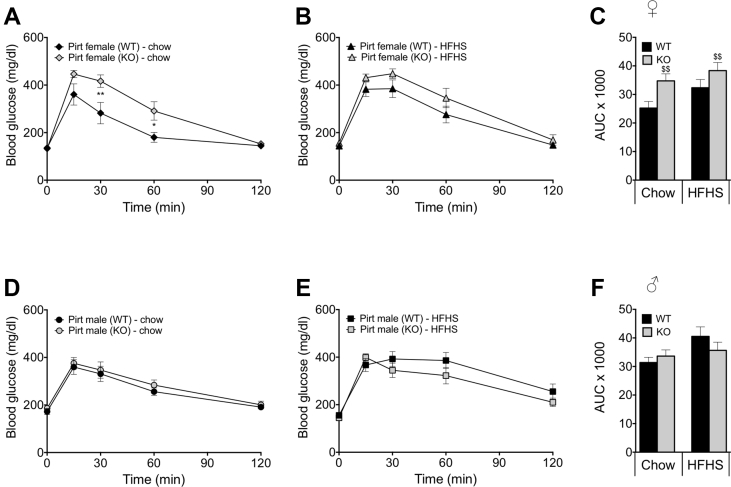
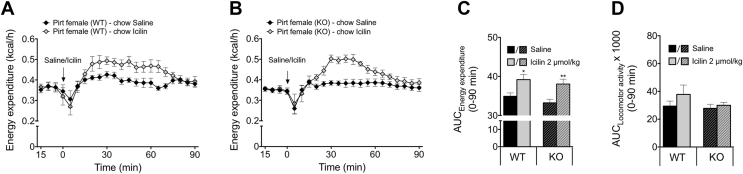
Results: We identified that chow-fed female Pirt-/- mice have an increased susceptibility to develop obesity and glucose intolerance. This effect is abrogated when the mice are exposed to a HFHS diet. Conversely, Pirt-/- male mice display no metabolic phenotype on either diet relative to wild-type (WT) control mice. Finally, we observed that Pirt is dispensable for TRPM8-evoked energy expenditure.

Conclusion: We here report subtle metabolic abnormalities in female, but not male, Pirt-/- mice. Future studies are required to tease out if metabolic stressors beyond dietary interventions, e.g. temperature fluctuations, are interacting with Pirt-signaling and metabolic control in a sex-specific fashion.

Keywords: Body weight; Brown adipose tissue; Energy metabolism; Sex differences; Signaling molecule; TRPM8.


Figures

Figure 1
Figure 1
Pirt is expressed in hypothalamic nuclei. Pirt gene expression, displayed as cycle of threshold (CT), in the heart muscle, pituitary gland, hypothalamus, quadriceps muscle, brown adipose tissue (BAT), inguinal white adipose tissue (iWAT), liver, and epididymal white adipose tissue (eWAT) of wild-type (WT) mice (n = 6) (A). Immunohistochemistry in the region of the arcuate nucleus (ARH), the median eminence (ME), and part of the ventromedial hypothalamic nucleus (VMH) of brain slices from WT and Pirt−/− (KO) mice (B). Pirt gene expression in the hypothalamus of WT mice compared to Pirt−/− mice (n = 5 per genotype) (C). Scale bars in (B) are 100 μm. Data represent mean ± s.e.m. ***P < 0.001 determined by an unpaired two-tailed Student's t-test comparing WT with Pirt−/− mice. 3V: Third ventricle.
Figure 2
Figure 2
Sex- and diet-specific effects of Pirt deficiency on energy metabolism. Body weight progression of female wild-type (WT) (black) and Pirt−/− (KO) (grey) mice on a standard chow (A) and high-fat, high-sugar (HFHS) diet (B). Fat mass (C) and lean mass (D) of the female cohorts at 27 weeks of age. Body weight progression of male WT and Pirt−/− mice on a standard chow (E) and HFHS diet (F). Fat mass (G) and lean mass (H) of the male cohorts at 27 weeks of age. Energy expenditure (I), respiratory exchange ratio (RER) (J), and mean locomotor activity (K) of female chow-fed WT and Pirt−/− mice at 27 weeks of age. Average daily food intake in female chow-fed WT and Pirt−/− mice from week 8 to week 25 of age (L). Phenotyping cohorts with n = 8 per sex, diet, and genotype. Data represent mean ± s.e.m. Data presented in longitudinal graphs (A,B,E,F,I,J) were analyzed by two-way ANOVA (genotype and time) and data presented in bar graphs (C,D,G,H,K,L) were analyzed by two-way ANOVA (genotype and diet) or an unpaired two-tailed Student's t-test comparing WT with Pirt−/− mice. ANOVA was followed by Bonferroni post hoc multiple comparison analysis to determine statistical significance. *P < 0.05, **P < 0.01 effects of genotype within the diets and $P < 0.05 main effects of genotype irrespective of diet.
Figure 3
Figure 3
Female Pirt deficient mice have an impaired glucose tolerance. Blood glucose traces after an intraperitoneal glucose tolerance test in female chow-fed (A) and high-fat, high-sugar (HFHS) diet-fed (B) and male chow-fed (D) and HFHS diet-fed (E) wild-type (WT) (black) and Pirt−/− (KO) (grey) mice with the corresponding area under the curve (AUC) (C,F) at 26 weeks of age. Phenotyping cohorts with n = 8 per sex, diet, and genotype. Data represent mean ± s.e.m. Data presented in line graphs (A,B,D,E) were analyzed by two-way ANOVA (genotype and time) and data presented in bar graphs (C,F) were analyzed by two-way ANOVA (genotype and diet) comparing WT with Pirt−/− mice. ANOVA was followed by Bonferroni post hoc multiple comparison analysis to determine statistical significance. *P < 0.05, **P < 0.01 effects of genotype within the diets and $$P < 0.01 main effects of genotype irrespective of diet.
Figure 4
Figure 4
Pharmacological activation of TRPM8 with icilin induces energy expenditure in wild-type and Pirt−/− mice. Energy expenditure of female chow-fed wild-type (WT) (A) and Pirt−/− (KO) mice (B) after subcutaneous injections of icilin (2 μmol/kg) (grey) or saline control (black) (n = 8 per genotype) with respective area under the curve (AUC) after icilin and saline injections (0–90 min) (C) and AUC of locomotor activity in the same period (D). Data represent mean ± s.e.m. *P < 0.05, **P < 0.01 determined by an unpaired two-tailed Student's t-test comparing saline and icilin injections within genotype.

References

    1. Ng M., Fleming T., Robinson M., Thomson B., Graetz N., Margono C. Global, regional, and national prevalence of overweight and obesity in children and adults during 1980–2013: a systematic analysis for the Global Burden of Disease Study 2013. Lancet. 2014;384(9945):766–781. - PMC - PubMed
    1. Tseng Y.H., Kokkotou E., Schulz T.J., Huang T.L., Winnay J.N., Taniguchi C.M. New role of bone morphogenetic protein 7 in brown adipogenesis and energy expenditure. Nature. 2008;454(7207):1000–1004. - PMC - PubMed
    1. Cypess A.M., Kahn C.R. Brown fat as a therapy for obesity and diabetes. Current Opinion in Endocrinology Diabetes and Obesity. 2010;17(2):143–149. - PMC - PubMed
    1. Cypess A.M., Lehman S., Williams G., Tal I., Rodman D., Goldfine A.B. Identification and importance of brown adipose tissue in adult humans. New England Journal of Medicine. 2009;360(15):1509–1517. - PMC - PubMed
    1. van Marken Lichtenbelt W.D., Vanhommerig J.W., Smulders N.M., Drossaerts J.M., Kemerink G.J., Bouvy N.D. Cold-activated brown adipose tissue in healthy men. New England Journal of Medicine. 2009;360(15):1500–1508. - PubMed

Publication types

MeSH terms