. 2019 May;7(5):805-812.
doi: 10.1158/2326-6066.CIR-18-0499. Epub 2019 Mar 22.

Multiple Immune-Suppressive Mechanisms in Fibrolamellar Carcinoma

Affiliations

Multiple Immune-Suppressive Mechanisms in Fibrolamellar Carcinoma

Amy K Kim et al. Cancer Immunol Res. 2019 May.

Abstract

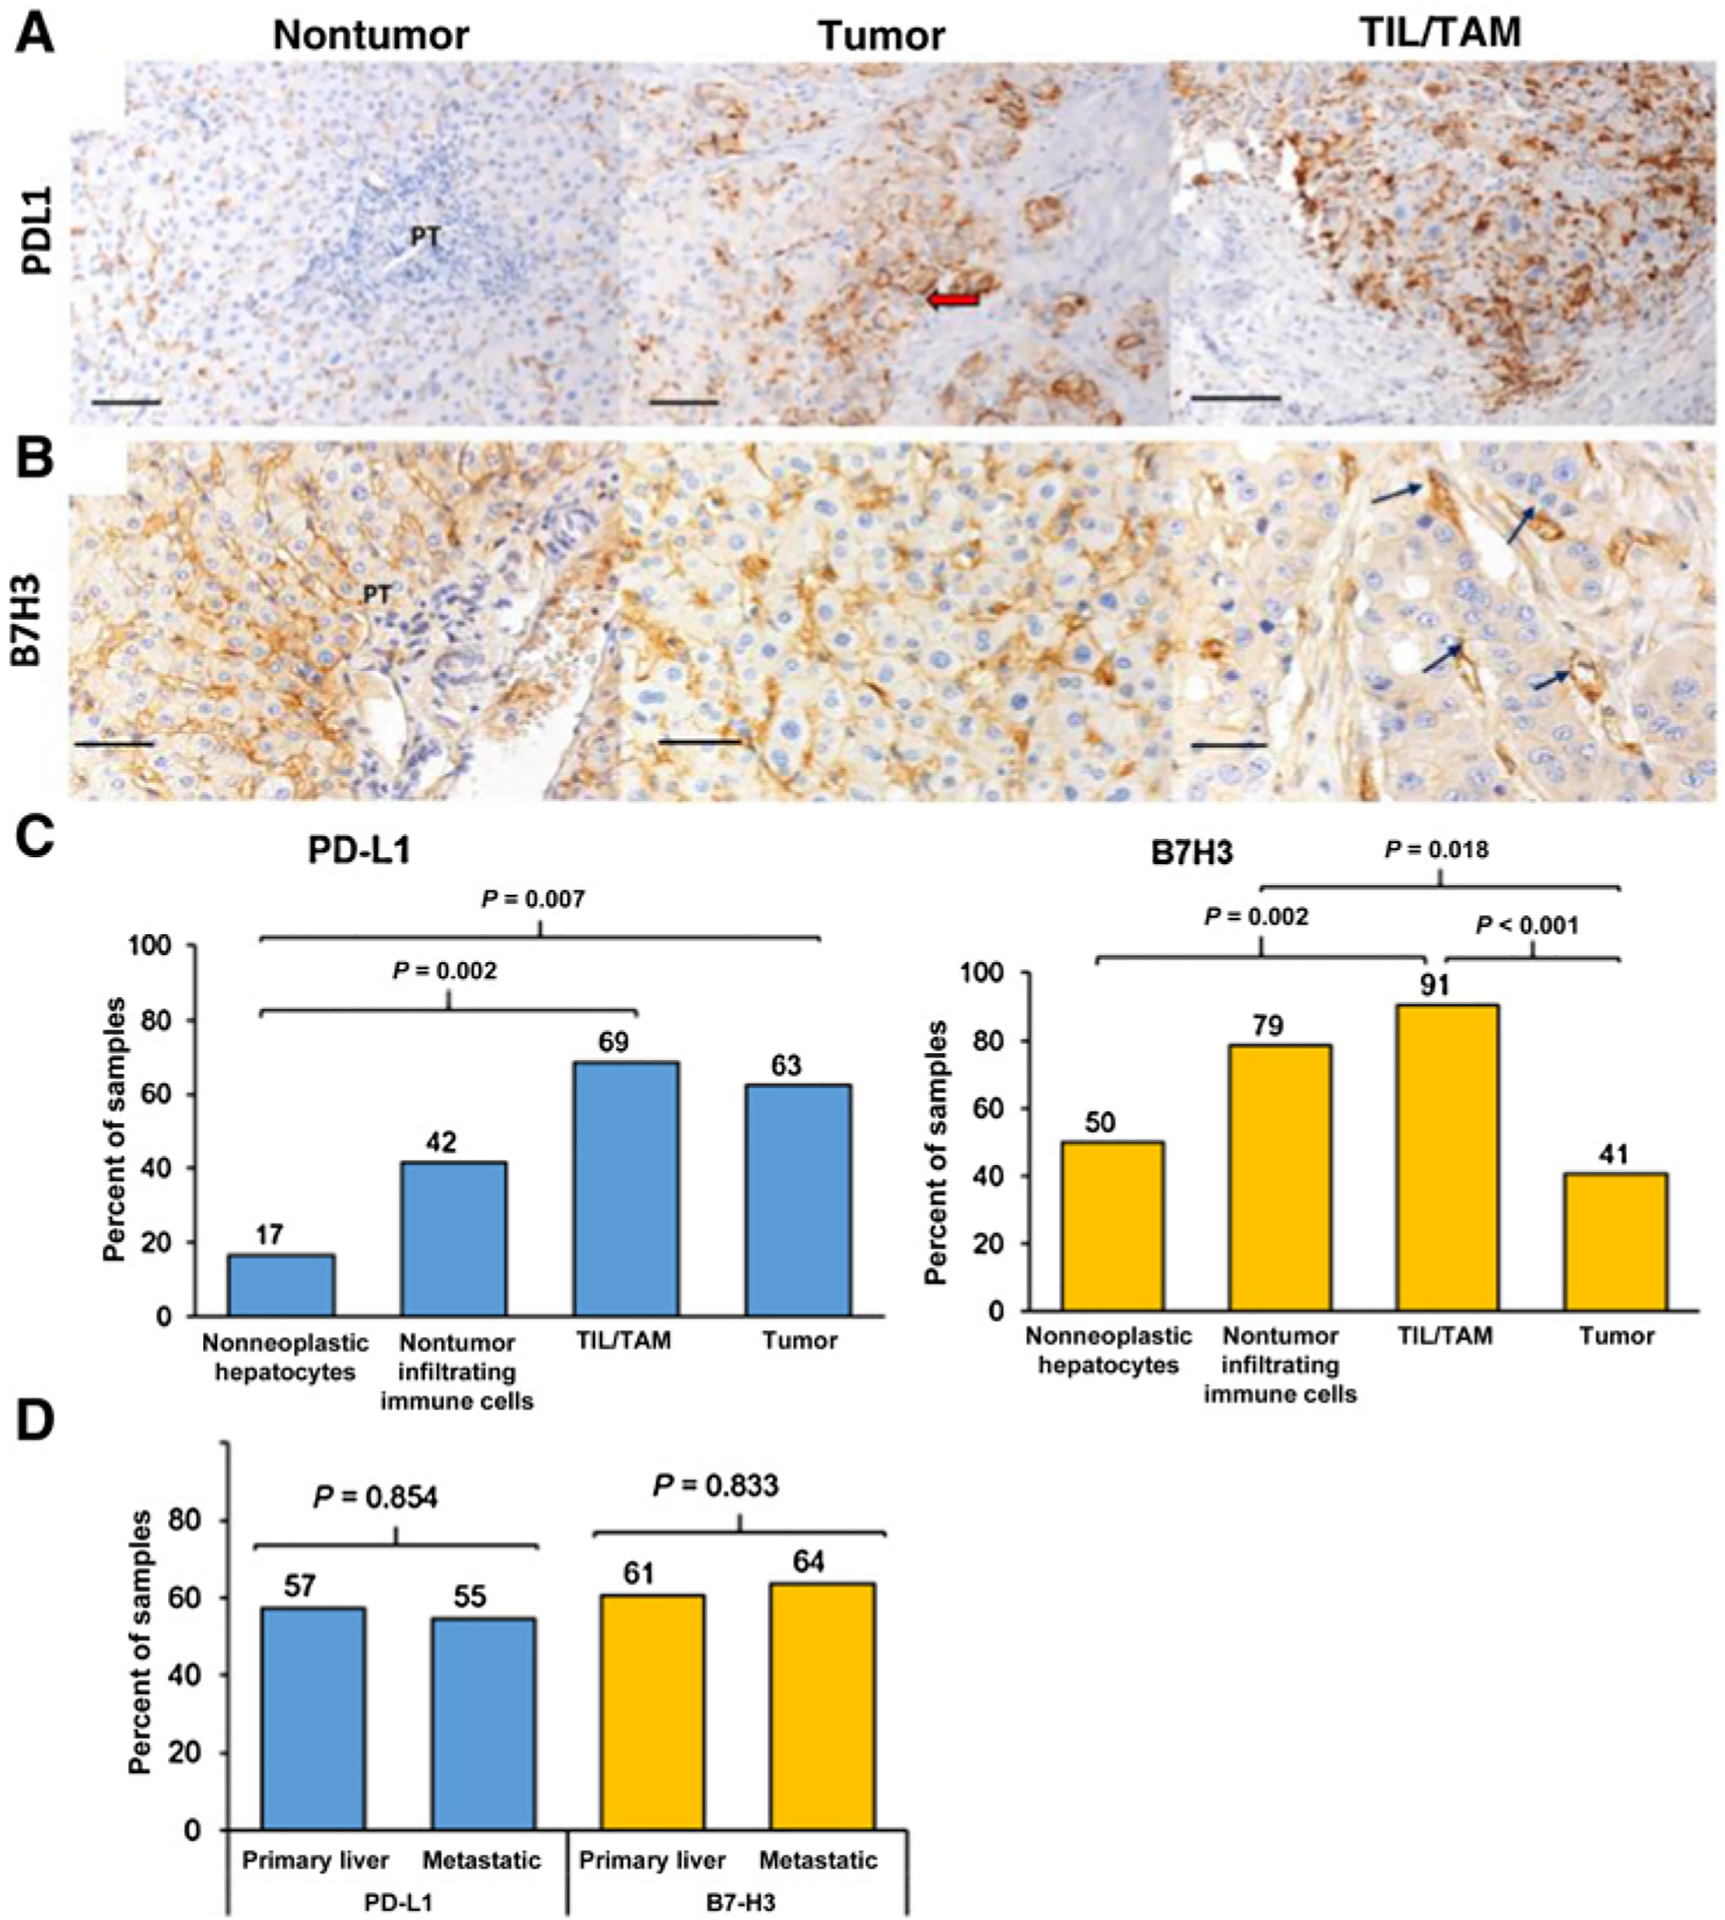
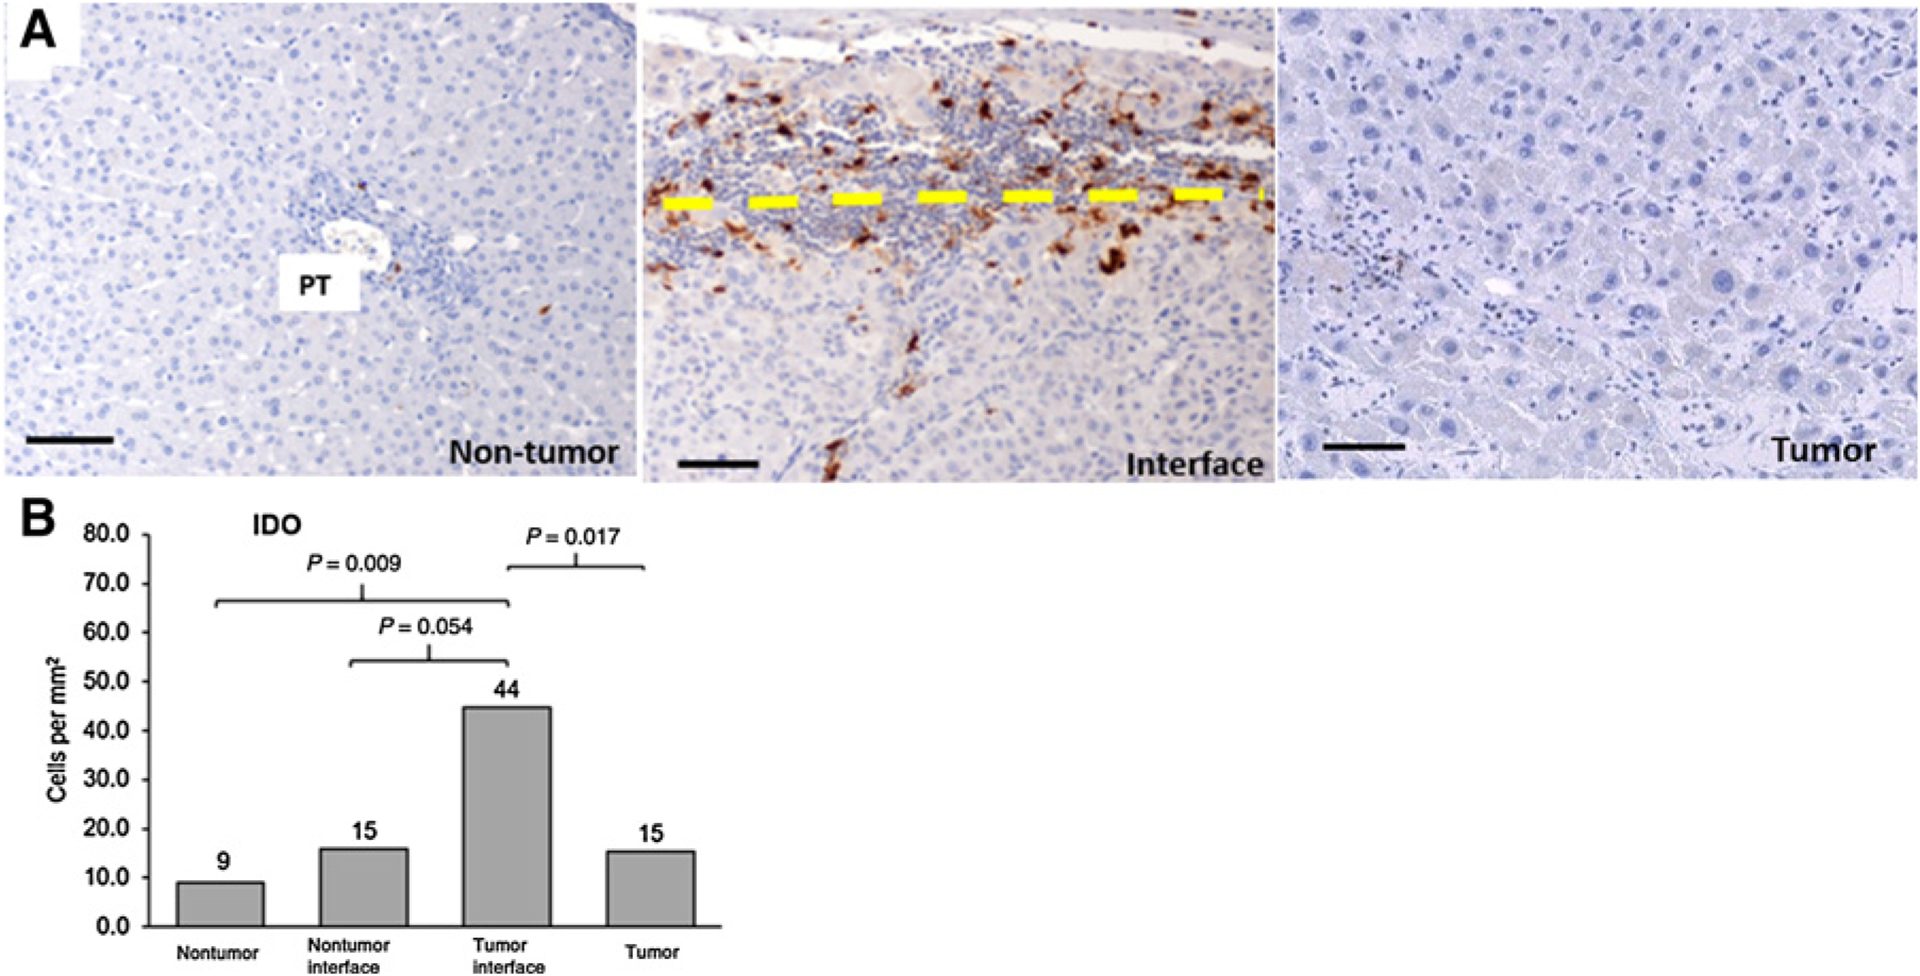
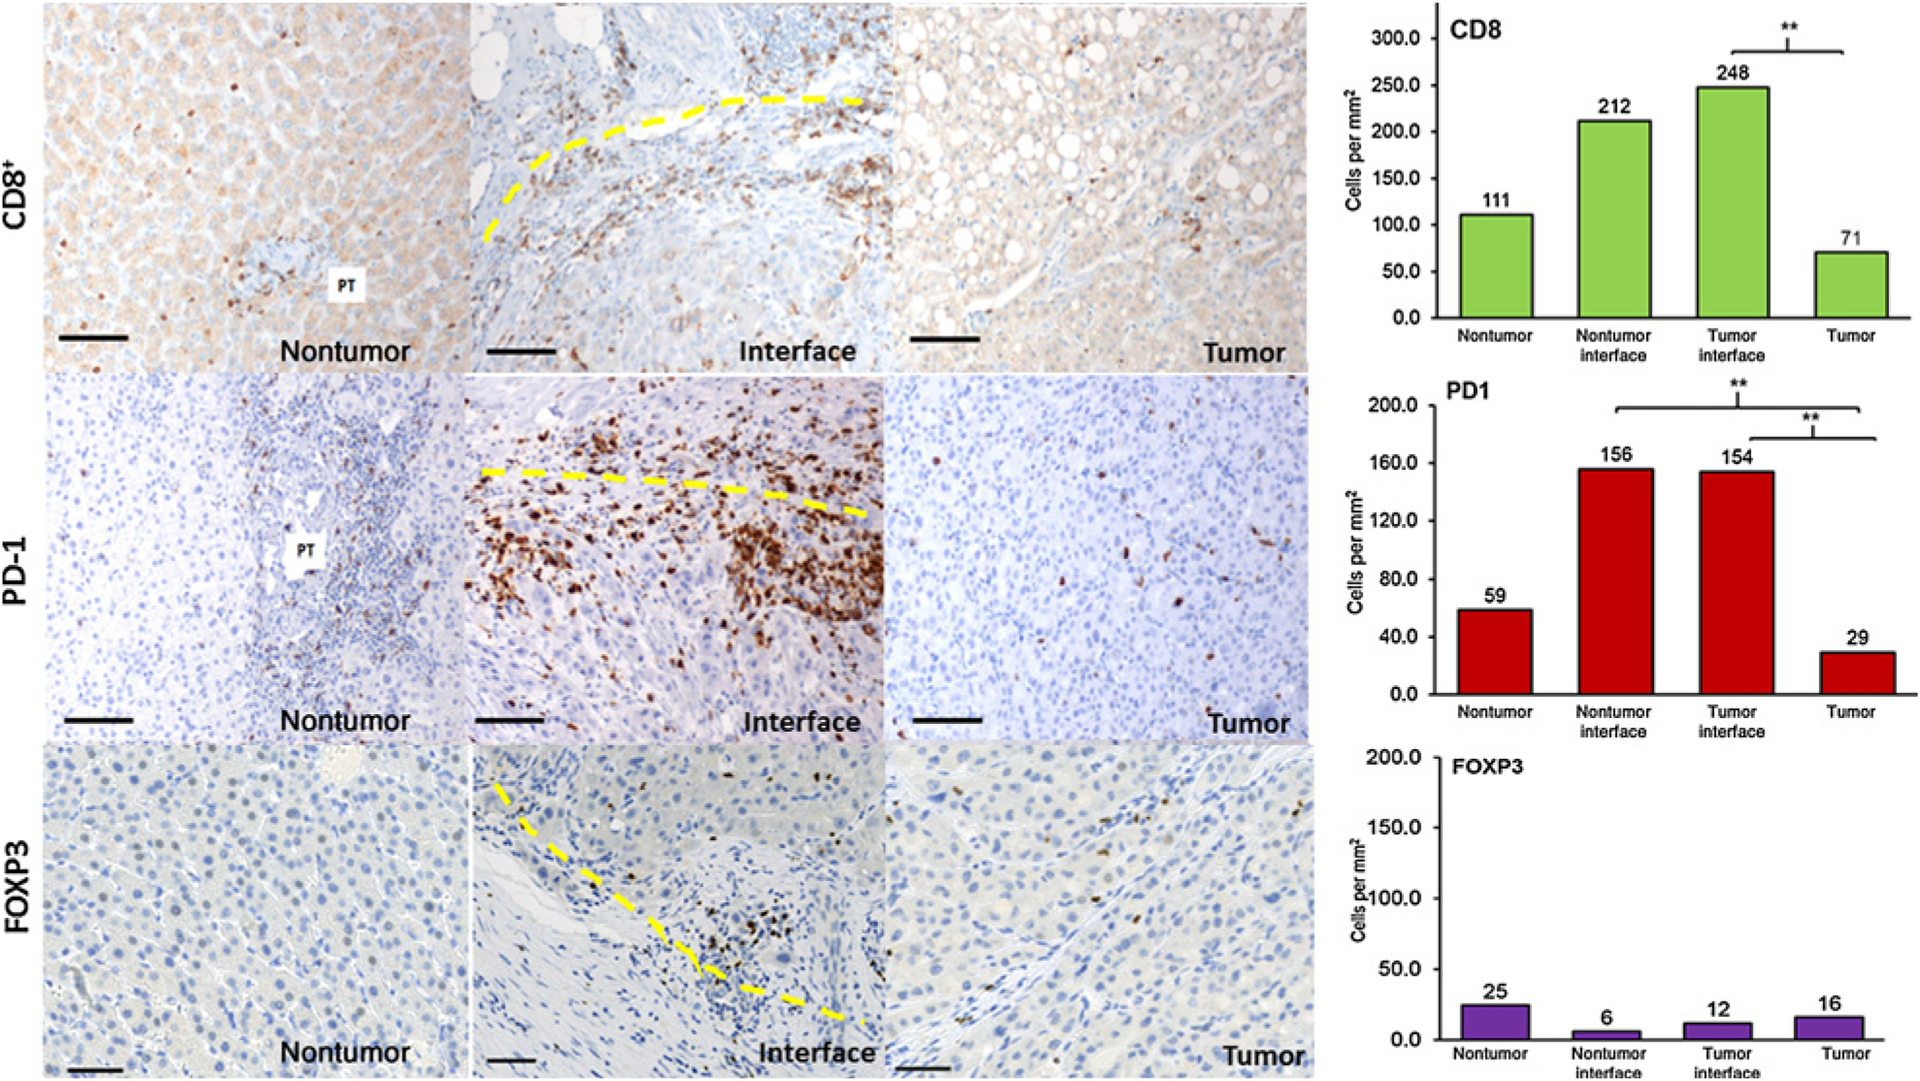
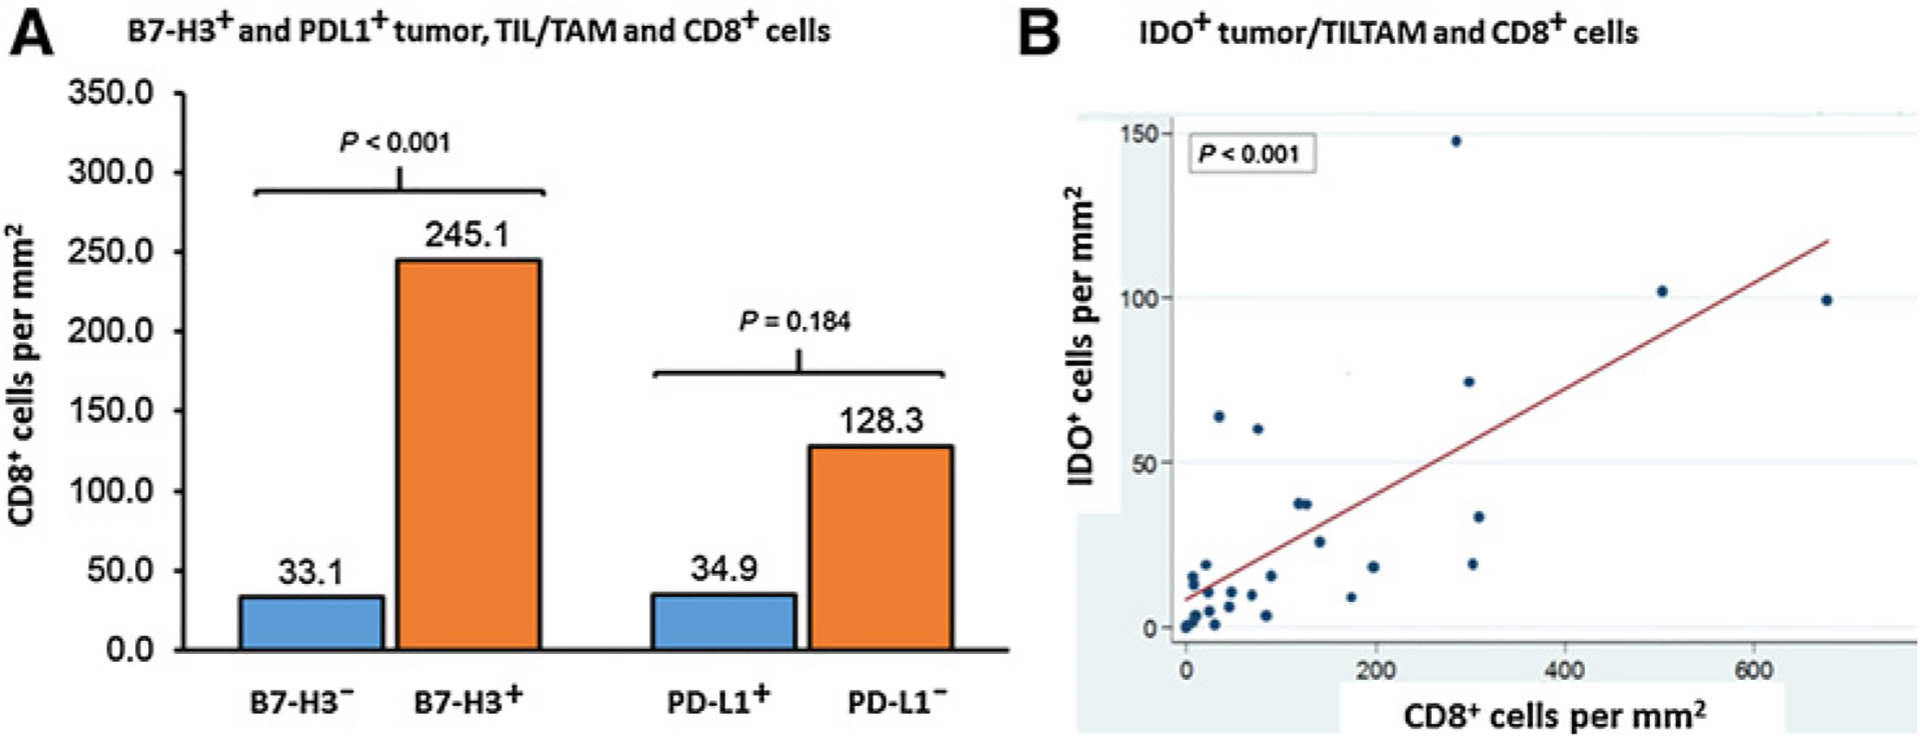
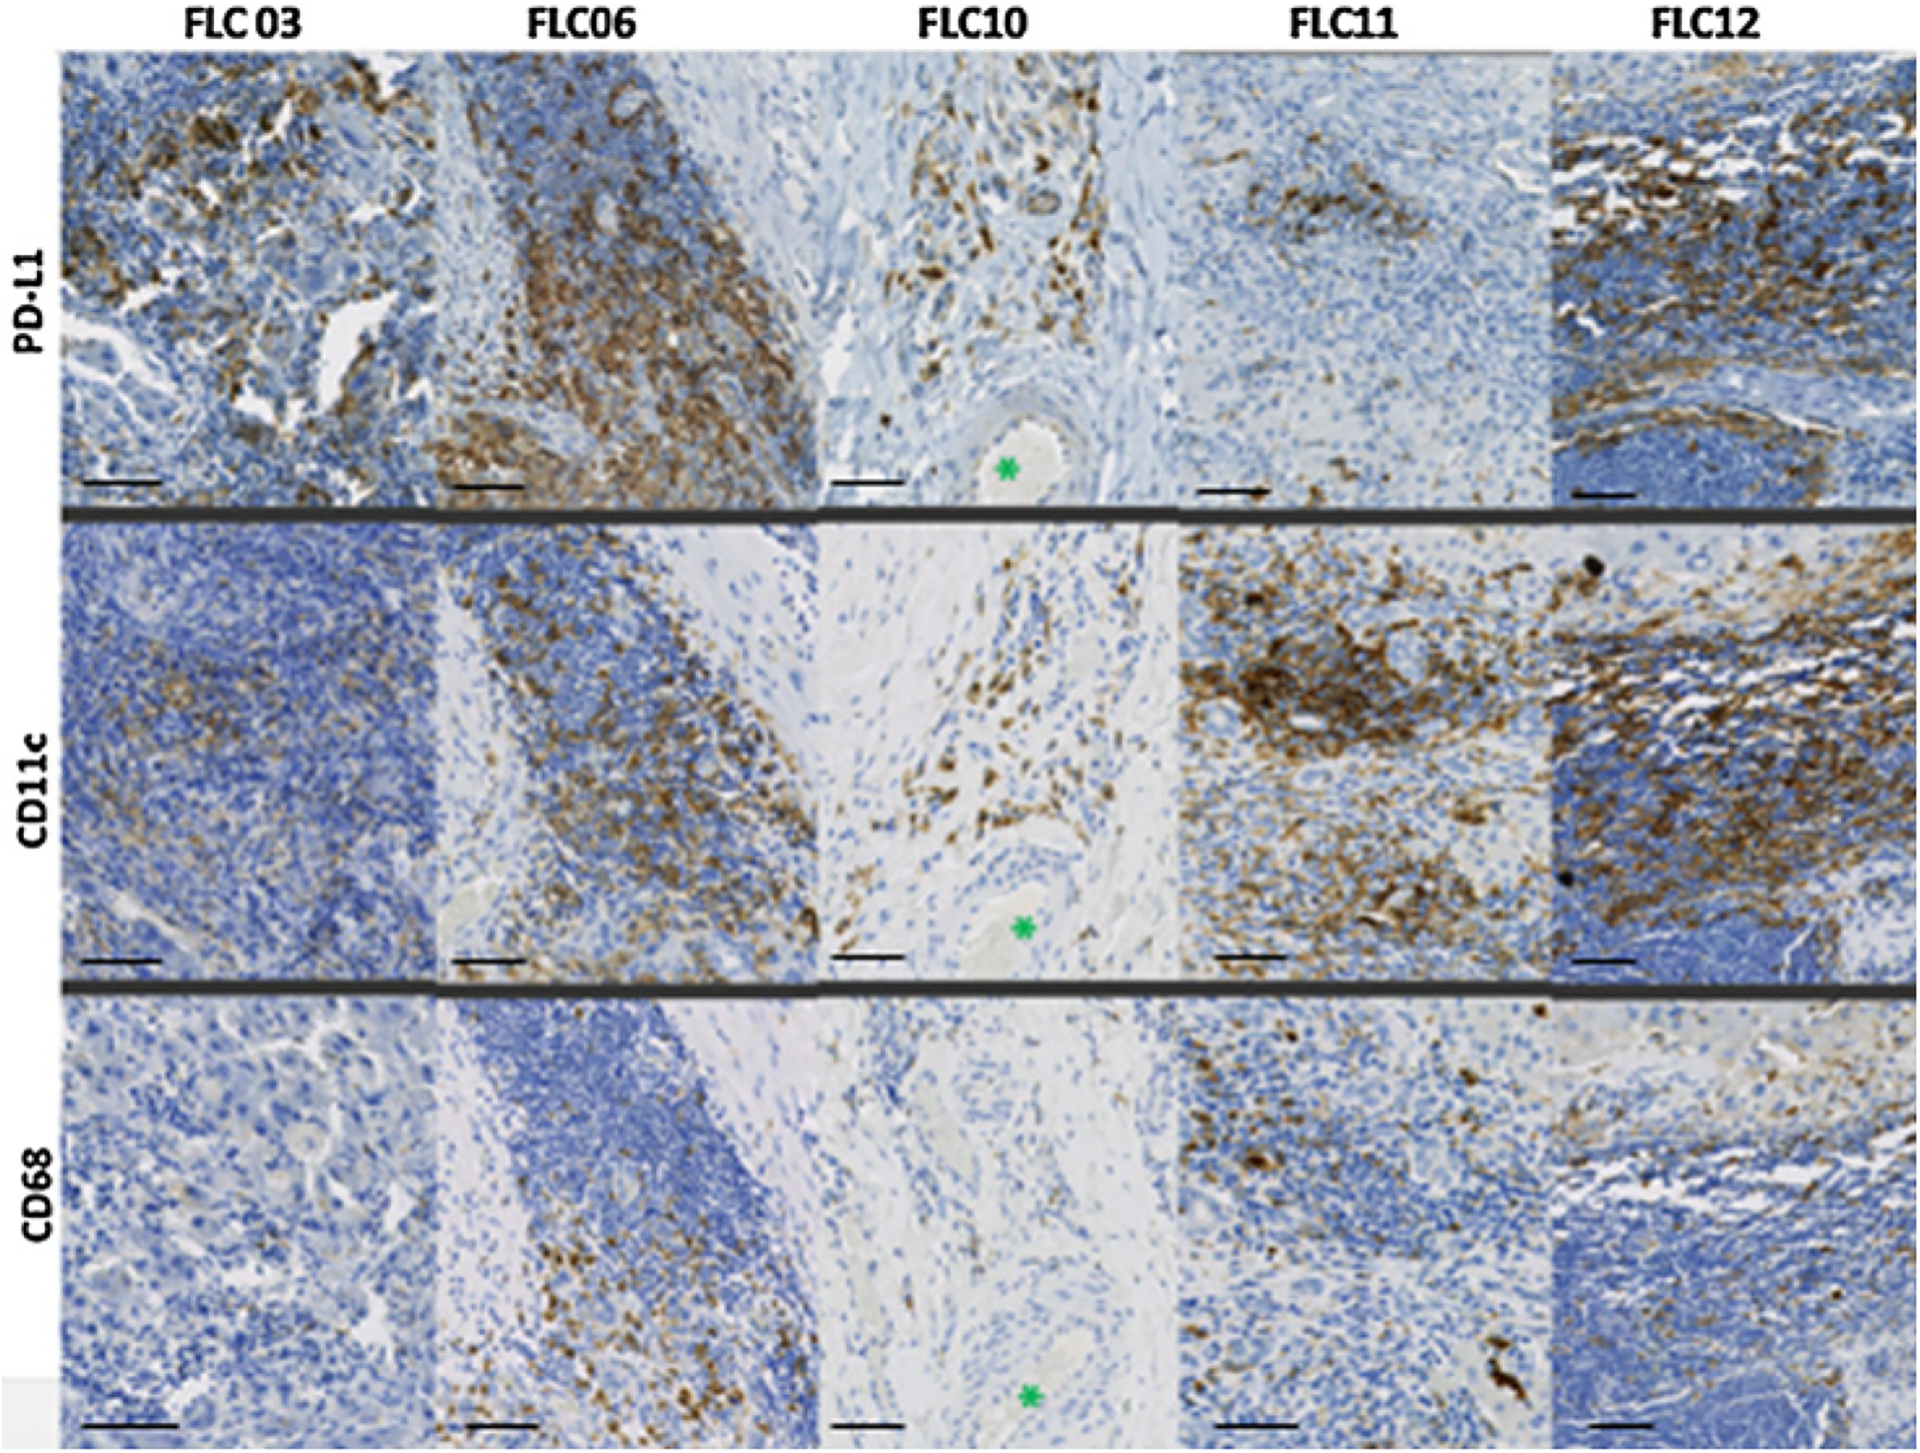
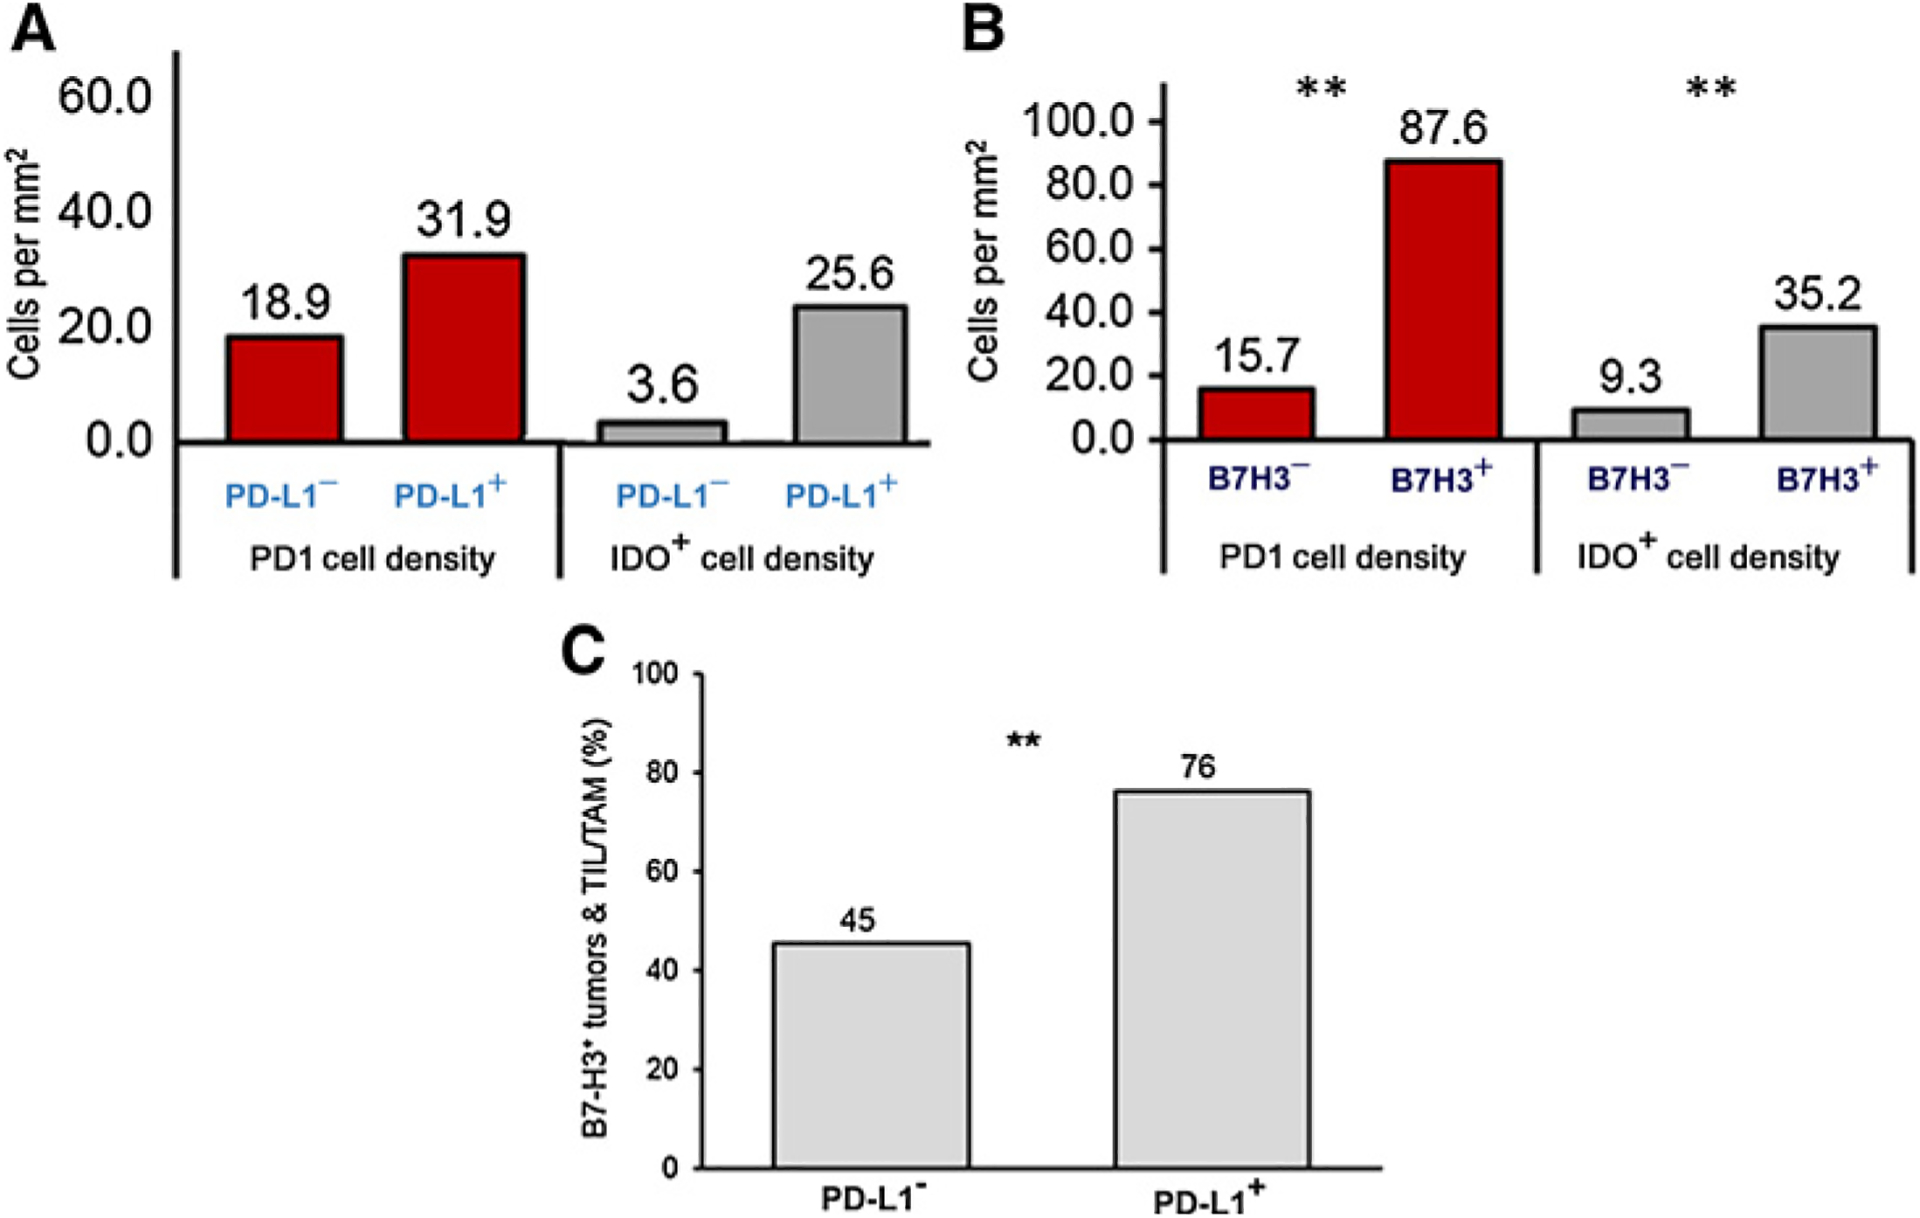
Fibrolamellar carcinoma (FLC) is a rare type of liver cancer that affects adolescents and young adults. The most effective treatment for FLC is surgical resection, but no standardized systemic therapy exists for patients with recurrent or unresectable FLC. As a first step to understand the immune microenvironment of FLC, we investigated targetable immune-checkpoint pathways, PD-1, PD-L1, B7-H3, IDO-1, and LAG3, in relation to CD8+ cytotoxic T-lymphocyte density. Thirty-two FLC tumor specimens were analyzed using IHC staining for PD-L1, CD8, PD-1, IDO, LAG3, and B7-H3. Sixty-three percent of FLC cases demonstrated membranous PD-L1 expression on tumor cells, and almost 70% of cases demonstrated PD-L1+ tumor-infiltrating lymphocytes and tumor-associated macrophages (TIL/TAM). Myeloid-derived cells appeared to be a major component of PD-L1+ tumor-infiltrating immune cells. Forty percent of the cases showed B7-H3 expression in the tumor zone, with 91% cases showing B7-H3 expression in TILs and TAMs. IDO and PD-1 expression was highest in the tumor interface zone. B7-H3 or IDO expression on tumor cells significantly correlated with higher CD8+ T-cell density. In conclusion, a high proportion of FLC cases showed robust expression of PD-1, PD-L1, B7-H3, and IDO in an adaptive immune-resistance pattern. Our findings provide further basis for targeting these different immune-checkpoint axes in FLC.


Figures

Figure 1.
Figure 1.
PD-L1 and B7-H3 in the FLC TME. A, Specimens were stained with PD-L1, and its expression in nontumor hepatocytes, tumor cells, and tumor-infiltrating lymphocytes and macrophages (TILs/TAMs) is shown. Red arrow shows membranous expression of PD-L1 in tumor cells. PT, portal tract. B, Specimens were stained with B7-H3, and its expression in nontumor hepatocytes, tumor cells, and TILs/TAMs is shown. Immune cells lining the sinusoids are indicated with black arrows. C, Percentages indicate the proportion of positively stained specimens in each representative region of FLC for PD-L1 and B7-H3 using 32 tumor regions and 15 nontumor regions per patient specimen. D, Comparison of primary tumor (n = 20) and metastatic sites (n = 12) for PD-L1 and B7-H3 expression in tumor and TILs/TAMs. Specimens shown in 20 magnification with a 100-μm scale bar, except for B7-H3 TILs/TAMs (B, right), which is at 40 × with a 50-μm scale bar. Pearson χ2 test was used between patient groups with a P value of ≤ 0.05 to define statistical significance.
Figure 2.
Figure 2.
A, IDO expression in the TME. Representative images of IDO expression in tumor and nontumor zones. The interface was further stratified as tumor-side (above the dashed line) and nontumor side (below the dashed line). Dark brown stains indicate IDO expression. PT, portal tract. B, Median cell densities of each region are shown above each bar. Scale bar, 100 μm. 20 × magnification. Thirty-one tumor regions, 10 tumor and nontumor interface regions, and 15 nontumor regions were analyzed. Quintile regression analysis was used with a P value of ≤ 0.05 to define statistical significance.
Figure 3.
Figure 3.
CD8+, PD-1+, and FOXP3+ expression in the TME. Nontumor regions, peritumoral interface, and tumor regions were stained by CD8+ (top row), PD-1+ (middle row), and FOXP3+ (bottom row) markers. Interface zone: yellow line. Scale bar, 100 μm. 20 × magnification. Graph: median cell densities of each region are shown above each bar graph. Thirty-one tumor regions, 10 tumor and nontumor interface regions, and 15 nontumor regions were analyzed. Quintile regression analysis was used with a P value of ≤ 0.05 to define statistical significance, as noted by **.
Figure 4.
Figure 4.
CD8+ T cells correlate with B7H3+, PD-L1+, and IDO+ tumor cells and TILs/TAMs. A, Median CD8+ T-cell density between B7-H3+ tumors, TILs, TAMs (orange bar), and B7-H3 tumors, TILs, TAMs (blue) are compared in the left side of the panel. Mean CD8+ cell density values are indicated above each bar. Median CD8+ T-cell density between PD-L1+ (orange) and PD-L1 (blue) specimens is shown on the right. A total of 32 tumor regions per specimen were used in the analysis. Quintile regression of medians was used with a P value of ≤ 0.05 to define statistical significance. B, Correlation analysis between the cell densities for IDO+ and CD8+ T cells was performed using linear regression and correlation coefficient. TIL/TAM: tumor-infiltrating lymphocyte/tumor-associated macrophage.
Figure 5.
Figure 5.
PD-L1+ expression in myeloid-derived cells. Five selected specimens with PD-L1+ expression were stained for myeloid-derived cells by staining for CD11c and CD68. The same location of the tissue is presented for comparison within each sample. Asterisks indicate an artery for location comparison. Specimens shown in 20 × magnification with a 100-μm scale bar.
Figure 6.
Figure 6.
Coexpression of different immune-checkpoint markers. A, PD-1 (red) and IDO (gray) median cell densities in tumors with and without PD-L1 expression and B, in tumors with and without B7H3 expression. 32 tumor regions were analyzed. Mean cell densities are indicated above each bar. Quantile regression was used with a P value of ≤ 0.05 to define statistical significance. C, Percentage of B7-H3 expression in tumors and TILs/TAMs with PD-L1 expression was compared with specimens without PD-L1 expression. Percentage is indicated above each bar. Pearson χ2 test was used with a P value of ≤ 0.05 for significance, as noted by **.

References

    1. Cornella H, Alsinet C, Sayols S, Zhang Z, Hao K, Cabellos L, et al. Unique genomic profile of fibrolamellar hepatocellular carcinoma. Gastroenterology 2015;148:806–18.e10. - PMC - PubMed
    1. Graham RP, Yeh MM, Lam-Himlin D, Roberts LR, Terracciano L, Cruise MW, et al. Molecular testing for the clinical diagnosis of fibrolamellar carcinoma. Mod Pathol 2018;31:141. - PMC - PubMed
    1. Honeyman JN, Simon EP, Robine N, Chiaroni-Clarke R, Darcy DG, Lim IIP, et al. Detection of a recurrent DNAJB1-PRKACA chimeric transcript in fibrolamellar hepatocellular carcinoma. Science 2014;343:1010–4. - PMC - PubMed
    1. El-Serag HB, Davila JA. Is fibrolamellar carcinoma different from hepatocellular carcinoma? A US population-based study. Hepatology 2004;39: 798–803. - PubMed
    1. Darcy DG, Malek MM, Kobos R, Klimstra DS, DeMatteo R, La Quaglia MP. Prognostic factors in fibrolamellar hepatocellular carcinoma in young people. J Pediatr Surg 2015;50:153–6. - PMC - PubMed

Publication types

Supplementary concepts