

Actin filaments regulate microtubule growth at the centrosome
- PMID: 30902847
- PMCID: PMC6545561
- DOI: 10.15252/embj.201899630
Actin filaments regulate microtubule growth at the centrosome
Abstract
The centrosome is the main microtubule-organizing centre. It also organizes a local network of actin filaments. However, the precise function of the actin network at the centrosome is not well understood. Here, we show that increasing densities of actin filaments at the centrosome of lymphocytes are correlated with reduced amounts of microtubules. Furthermore, lymphocyte activation resulted in disassembly of centrosomal actin and an increase in microtubule number. To further investigate the direct crosstalk between actin and microtubules at the centrosome, we performed in vitro reconstitution assays based on (i) purified centrosomes and (ii) on the co-micropatterning of microtubule seeds and actin filaments. These two assays demonstrated that actin filaments constitute a physical barrier blocking elongation of nascent microtubules. Finally, we showed that cell adhesion and cell spreading lead to lower densities of centrosomal actin, thus resulting in higher microtubule growth. We therefore propose a novel mechanism, by which the number of centrosomal microtubules is regulated by cell adhesion and actin-network architecture.
Keywords: actin; cell adhesion; centrosome; microtubule.
© 2019 The Authors.
Conflict of interest statement
The authors declare that they have no conflict of interest.
Figures
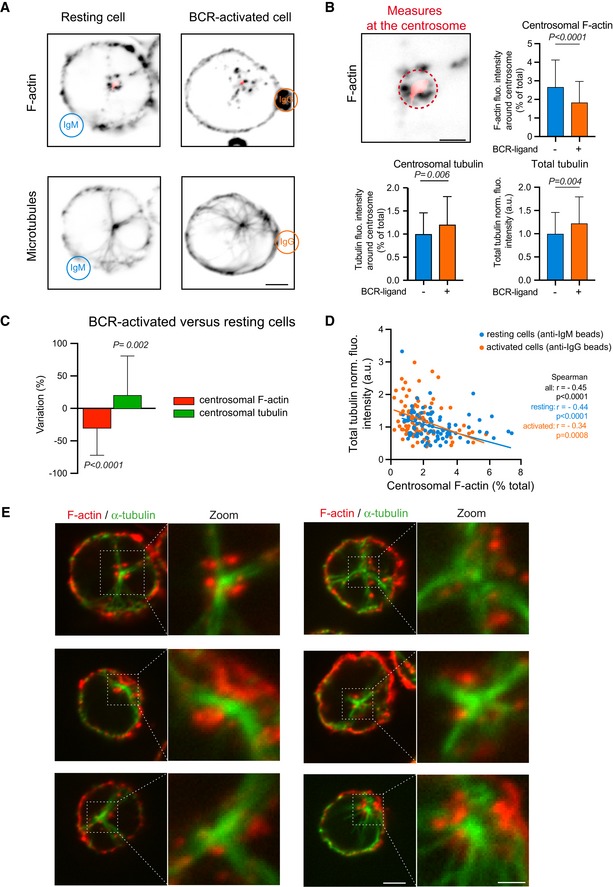
IIA1.6 B lymphoma cells were stimulated with BCR‐ligand− (anti‐IgM) or BCR‐ligand+ (anti‐IgG) beads for 60 min, fixed and stained for F‐actin (top) and α‐tubulin (bottom). Scale bar: 3 μm.
Histograms show the quantifications of the polymerized tubulin and F‐actin at the centrosome (dashed outline on the image, values correspond to the fraction of fluorescence in a 2‐micron‐wide area around the centrosome relative to the total fluorescence in the cell) and the total amount of polymerized tubulin (bottom right, values were normalized with respect to the mean of control condition). Measurements were pooled from three independent experiments; anti‐IgM (BCR‐ligand−): n = 88; anti‐IgG (BCR‐ligand+): n = 93. Error bars correspond to standard deviations. P values were calculated with Mann–Whitney test. Scale bar: 2 μm.
Percentage differences of centrosomal F‐actin and centrosomal microtubule fluorescence intensities in cells stimulated with BCR‐ligand+ beads with respect to cells stimulated with BCR‐ligand− beads. The data set is identical to panel (B). Measurements were pooled from three independent experiments; anti‐IgM (BCR‐ligand−): n = 88; anti‐IgG (BCR‐ligand+): n = 93. Error bars correspond to standard deviations. P values were calculated with one‐sample t‐test (i.e. comparison to a theoretical mean of “0”).
The graph shows the variations of the total amount of polymerized tubulin per cell with respect to the content of F‐actin at the centrosome in an XY representation of individual measurements. The two lines correspond to linear regressions of the two sets of data relative to cells stimulated with BCR‐ligand+ (activated cells) or BCR‐ligand− (resting cells) beads.
IIA1.6 B lymphoma cells were fixed and immuno‐stained for F‐actin (red) and α‐tubulin (green). Images show the projection of maximal intensity of three confocal slices spaced by 0.5 μm apart from the centrosome. Scale bars: 2 μm (0.5 μm in the zoomed insets).
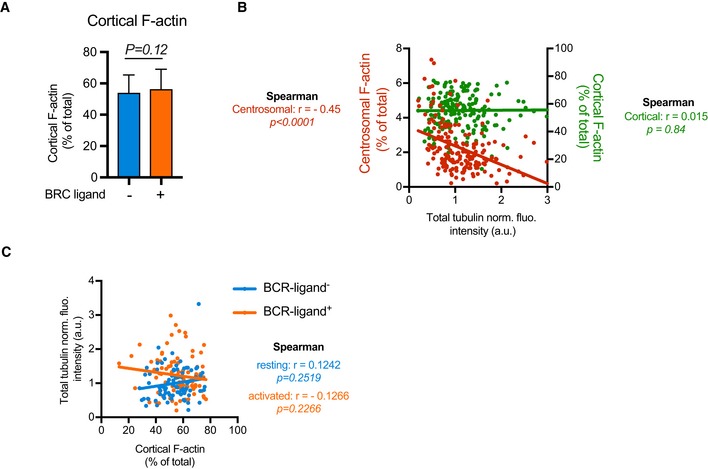
Histograms show the quantifications of the amount of F‐actin at the cortex of B lymphoma cells. Measurements were pooled from three independent experiments; anti‐IgM (BCR‐ligand−): n = 88; anti‐IgG (BCR‐ligand+): n = 93. Error bars correspond to standard deviations. P values were calculated from Mann–Whitney test.
Graph shows the variations of the fluorescence intensities of cortical F‐actin (green) or centrosomal F‐actin (red) with respect to the total amount of polymerized tubulin in resting and activated cells (values were normalized with respect to the mean values of all measured cells). The two lines correspond to linear regressions of the two sets of data. The Spearman correlation test indicates the correlation coefficient r and the P value of the significance of the correlation. Only centrosomal actin appeared correlated to the total content of polymerized tubulin.
The graph shows the variations of the total amount of polymerized tubulin per cell with respect to the content of cortical actin in an XY representation of individual measurements. The two lines correspond to linear regressions of the two sets of data relative to cells stimulated with BCR‐ligand+ (activated cells) or BCR‐ligand− (resting cells) beads. In none of the two cases, the total amount of polymerized tubulin appeared correlated to the proportion of cortical actin filaments.
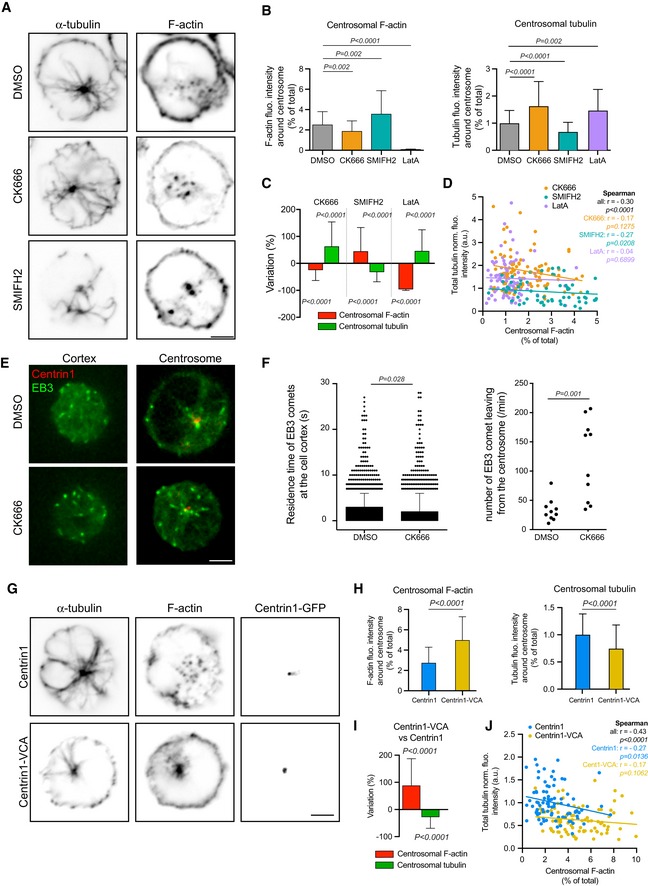
IIA1.6 B lymphoma cells were treated 45 min with indicated inhibitors (CK666 at 25 μM, SMIFH2 at 25 μM) or DMSO as control prior to being fixed and stained for α‐tubulin (left column) and F‐actin (right column). Scale bar: 3 μm.
Histograms show the quantifications of the amount of polymerized tubulin (right, values were normalized with respect to the mean of control condition) and F‐actin at the centrosome (left, values correspond to the fraction of fluorescence in a 2‐micron‐wide area around the centrosome relative to the total fluorescence in the cell). Measurements were pooled from three independent experiments; DMSO: n = 91, CK666: n = 82, SMIFH2: n = 74, latrunculin A: n = 96. Error bars correspond to standard deviations. P values were calculated with Mann–Whitney test.
Percentage differences of centrosomal F‐actin and microtubule fluorescence intensities in cells treated with cytoskeleton inhibitors in comparison with the respective densities in cells treated with DMSO. Error bars represent standard deviations. P values were calculated with one‐sample t‐test (i.e. comparison to a theoretical mean of “0”).
The graph shows the same measurements as in panel (B) in an XY representation of individual measurements. The three lines correspond to linear regressions of the three sets of data relative to cells treated with each actin drug.
IIA1.6 B lymphoma cells were transfected to transiently express centrin1‐GFP (red) and EB3‐mCherry (green) and video‐recorded at the contact site with the glass coverslip (left) and at the centrosome (right). Scale bar: 3 μm.
The duration of EB3‐positive comets’ presence in the bottom plane was measured in DMSO‐ and CK666‐treated cells (left). Error bars correspond to standard deviations. The number of EB3‐positive comets exiting a 2‐μm‐wide centrosomal area was also compared between the two conditions (right). In both cases, P values were calculated with Mann–Whitney test.
IIA1.6 B lymphoma cells were transfected to transiently express centrin1‐VCA‐GFP (bottom) or centrin1‐GFP (top) as control prior to be fixed and stained for α‐tubulin (left column) and F‐actin (middle column). The GFP signal of centrin1 or centrin1‐VCA is shown in the right column to illustrate the proper centrosome targeting. Scale bar: 3 μm.
Histograms show the quantifications of the amount of polymerized tubulin (right) and F‐actin at the centrosome (left). Values correspond to the fraction of fluorescence in a 2‐micron‐wide area around the centrosome relative to the total fluorescence in the cell. Measurements were pooled from three independent experiments; centrin1‐GFP: n = 88, centrin1‐VCA‐GFP: n = 87. Error bars represent standard deviations. P values were calculated with Mann–Whitney test.
Percentage differences of F‐actin and polymerized tubulin fluorescence intensities at the centrosome were compared in cells transfected either with centrin1‐VCA‐GFP or with centrin1‐GFP. Error bars represent standard deviations. P values were calculated with one‐sample t‐test (i.e. comparison to a theoretical mean of “0”).
The graph shows the variations of the total amount of polymerized tubulin per cell with respect to the content of F‐actin at the centrosome. The two lines correspond to linear regressions of the two sets of data relative to cells transfected with centrin1‐VCA‐GFP or centrin1‐GFP.
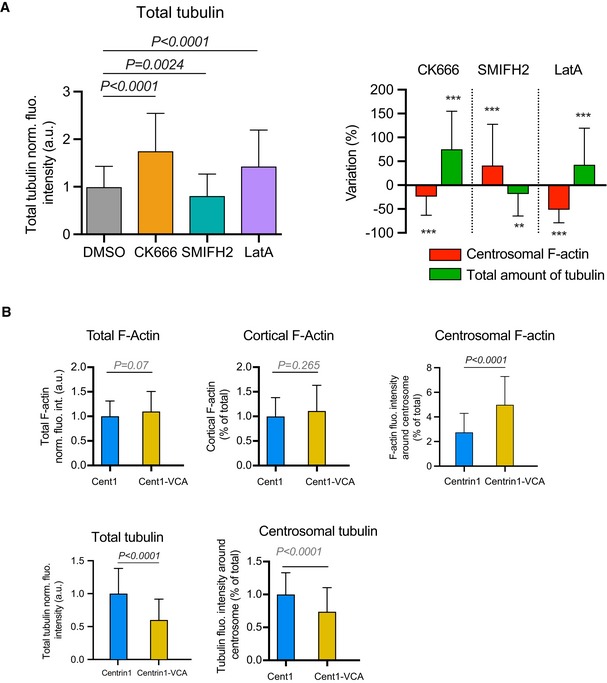
Histograms on the left show the quantifications of the total amount of polymerized tubulin (values were normalized with respect to the mean of control condition). Error bars correspond to standard deviations. P values were calculated with Mann–Whitney test. Histograms on the right show the percentage differences of centrosomal F‐actin as compared to the variations of the total microtubule fluorescence intensities in cells treated with cytoskeleton inhibitors in comparison with the respective densities in cells treated with DMSO. Error bars represent standard deviations. P values were calculated with one‐sample t‐test (i.e. comparison to a theoretical mean of “0”). The same data set was used for the two types of quantification (and for Fig 2B–D): measurements were pooled from three independent experiments; DMSO: n = 91, CK666: n = 82, SMIFH2: n = 74, latrunculin A: n = 96.
Histograms show the quantifications of the amount F‐actin in the entire cell (top left), at the cell cortex (top middle) and at the centrosome (top left) as well as the amount of polymerized tubulin in the entire cell (bottom left) and at the centrosome (bottom right). Values at the centrosome correspond to the fraction of fluorescence in a 2‐micron‐wide area around the centrosome relative to the total fluorescence in the cell. Measurements were pooled from three independent experiments; centrin1‐GFP: n = 88, centrin1‐VCA‐GFP: n = 87. Error bars represent standard deviations.

Two sets of representative images showing fluorescent microtubules and F‐actin assembled from isolated centrosomes. Centrosomes were isolated from Jurkat cells expressing centrin1‐GFP. Upper and lower lines show F‐actin and microtubules radiating from two distinct centrosomes with low (top) and high (bottom) densities of F‐actin. Scale bars: 10 μm.
The graph shows the number of microtubules per centrosome relative to the density of actin filaments. Inset shows F‐actin at the centrosome with a FIRE look‐up table and a 20‐μm‐wide circle in which F‐actin fluorescence intensity is measured. Measurements were pooled from five independent experiments; n = 50.
Microtubules (top line) and F‐actin (bottom line) assembly from isolated centrosomes in the presence of increasing concentration of monomeric actin (from left to right). Scale bar: 20 μm.
The graph shows the number of microtubules per centrosome in response to increasing concentrations of monomeric actin. Data were pooled from two independent experiments; 0 μM: n = 21; 0.3 μM: n = 17; 0.5 μM: n = 17; 1.0 μM: n = 17. ****P < 0.001 Mann–Whitney test.
The image shows the density of F‐actin (in the presence of 1 μM of actin monomers) at the centrosome colour‐coded with the FIRE look‐up table and the definition of central, peripheral and distal regions corresponding to decreasing concentrations of F‐actin. Scale bar: 20 μm. The graph shows the measurements of microtubule growth rate in each region. Data were pooled from three independent experiments: central zone: n = 58, peripheral: n = 104, outside: n = 61; n. s. means no statistical difference between the data set according to Mann–Whitney test.
The graphs show the various intensities of centrosome immuno‐staining with antibodies against gamma‐tubulin on the same coverslip depending on the presence/absence of F‐actin (left) or on the amount of F‐actin (right). Data were pooled from three independent experiments. Left graph: without F‐actin n = 69, with F‐actin n = 26, right graph n = 26. n.s. means no statistical difference between the data set according to Mann–Whitney test.
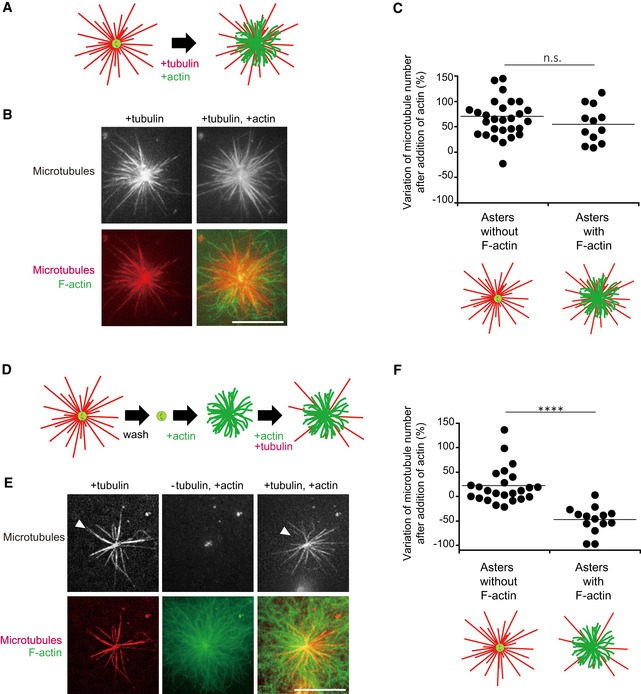
Schematic illustration of the first dynamic assay: sequential addition of tubulin followed by tubulin and actin on isolated centrosomes.
Representative images showing microtubules (top line) and the merged images of F‐actin and microtubules (bottom line) for the two steps of the assay; in the presence of tubulin only (left column) and in the presence of tubulin and actin (right column). Scale bar: 10 μm.
Quantification of the differences in the number of microtubules per centrosome between the two stages of the experiment described above on centrosomes capable (first condition), or not (second condition), to grow F‐actin. Data were collected from a single experiment; asters without F‐actin: n = 29; asters with F‐actin: n = 13. Data were analysed using Mann–Whitney test.
Schematic illustration of the second dynamic assay: tubulin is added to measure centrosome nucleation capacity and washed out. Then, actin is added followed by actin and tubulin.
Representative images showing microtubules (top line) and the merged images of F‐actin and microtubule (bottom line) during the three steps of the assay; in the presence of tubulin only (left column), in the absence of tubulin and presence of actin (middle column) and in the presence of tubulin and actin (right column). Scale bar: 10 μm. Arrowheads indicate microtubules unable to re‐grow after assembly of F‐actin.
Quantification of the differences in the number of microtubules per centrosome between the first and last steps of the experiment described above (panels D and E) on centrosomes capable (first condition), or not (second condition), to grow F‐actin. Data were pooled from two independent experiments; asters without F‐actin: n = 24; asters with F‐actin: n = 13. ****P < 0.001 Student's t‐test.
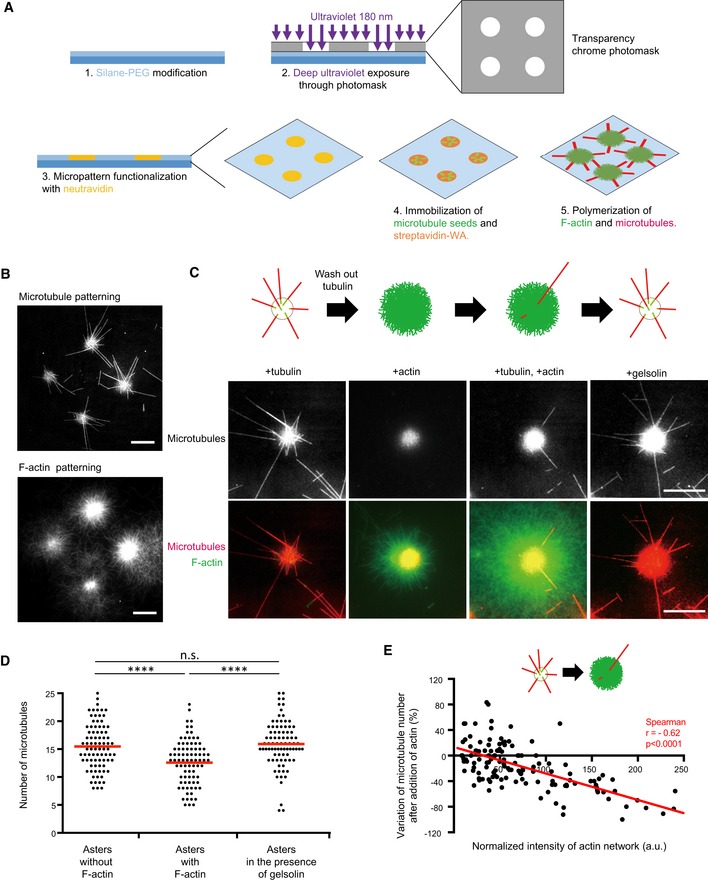
Schematic illustration of the micropatterning method used to graft microtubule seeds (green) via neutravidin (yellow) and F‐actin‐nucleation‐promoting complexes (streptavidin‐WA) (orange) on 8‐micron‐wide discoidal micropatterns. A glass coverslip (deep blue) coated with polyethyleneglycol (PEG) (light blue) was placed in contact with a transparency photomask and exposed to deep UV light. The exposed coverslip was then immersed with neutravidin to fix biotinylated microtubule seeds (green) on exposed regions. Streptavidin‐WA was immobilized on microtubule seeds via their interaction with biotin. Tubulin dimers and actin monomers were then added to allow filaments elongation.
Representative images of microtubules (top) and F‐actin (bottom) growth from micropatterns. Scale bars: 20 μm.
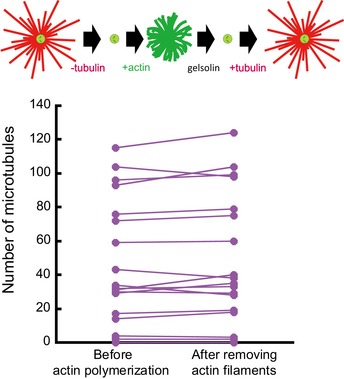
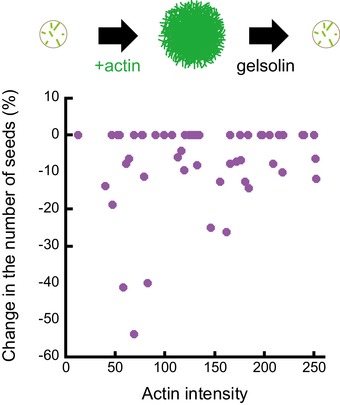
Schematic illustration of the assay on micropatterned substrate. Tubulin was first added alone to measure the nucleation capacity of each micropattern, and then washed out. Later on, actin was added followed by actin and tubulin. Finally, actin was rinsed out and gelsolin was added to fully disassemble F‐actin. Representative images showing microtubules (top line) and the merged images of actin filaments and microtubules (bottom line) during the four steps of the assay; in the presence of tubulin only, in the absence of tubulin and presence of actin, in the presence of tubulin and actin, and finally in the presence of tubulin and gelsolin but in the absence of actin (from left to right). Scale bars: 10 μm.
Quantification of the number of microtubules per micropattern in the presence of tubulin only (left), actin and tubulin (middle) and tubulin only after actin filament disassembly (right). Data were pooled from 2 independent experiments; n = 133. ****P < 0.001 Student's t‐test.
The graph shows the same measurements as in panel (E) in an XY representation of individual measurements. It illustrates the differences in the number of microtubules per micropattern between the first to the second step (tubulin only versus actin and tubulin together) with respect to the density of F‐actin per micropattern.
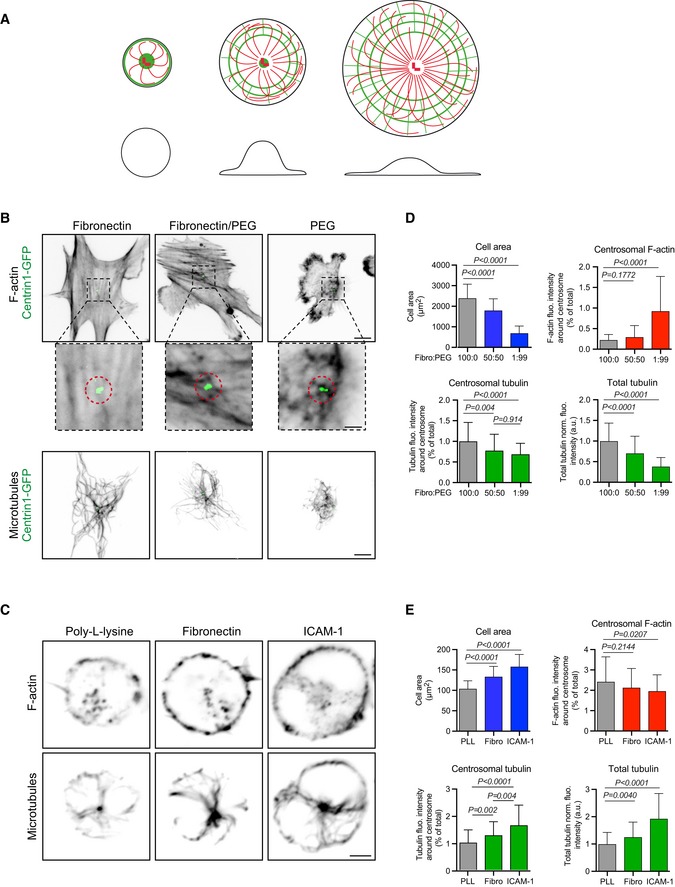
Schematic illustration of our model according to which cell spreading sequesters monomeric actin to the cortex and thereby enables the centrosome to grow more microtubules. Drawings show top (top line) and side views (bottom line) of cells with increased spreading from left to right. Actin filaments are in green; microtubules are in red.
RPE1 cells stably expressing centrin1‐GFP were plated for 3 h on coverslips coated with different ratios (100:0; 50:50 or 1:99) of fibronectin and PLL‐PEG prior to fixation and staining for F‐actin (top line and magnified views around centrosome below. Scale bars: 10 μm and 2 μm, respectively) and α‐tubulin (bottom line. Scale bar: 10 μm).
IIA1.6 B lymphoma cells were plated for 60 min on poly‐L‐lysine, fibronectin or ICAM‐1‐coated cover slides prior to be fixed and stained for F‐actin (top line) and α‐tubulin (bottom line). Scale bar: 3 μm.
Quantification of the area occupied by RPE1 cells on the substrate (top left), F‐actin content at the centrosome (top right), polymerized tubulin at the centrosome (bottom left) and in the entire cell (bottom right) for the three conditions of cell adhesion described in (B). Measurements came from three independent experiments with more than 60 analysed cells in each. Error bars represent standard deviations. F‐actin and microtubule contents were compared using Mann–Whitney test, and variations of the cell area were compared using unpaired t‐test.
Quantification of the area occupied by B lymphoma cells on the substrate (top left), F‐actin content at the centrosome (top right), polymerized tubulin at the centrosome (bottom left) and in the entire cell (bottom right) for the three conditions of cell adhesion described in (D). Measurements came from three independent experiments with more than 80 analysed cells in each. Error bars represent standard deviations. F‐actin and microtubule contents were compared using Mann–Whitney test, and variations of the cell area were compared using unpaired t‐test.
References
-
- Achard V, Martiel J‐L, Michelot A, Guérin C, Reymann A‐C, Blanchoin L, Boujemaa‐Paterski R (2010) A “primer”‐based mechanism underlies branched actin filament network formation and motility. Curr Biol 20: 423–428 - PubMed
-
- Akhmanova A, Steinmetz MO (2015) Control of microtubule organization and dynamics: two ends in the limelight. Nat Rev Mol Cell Biol 16: 711–726 - PubMed
-
- Andersen JS, Wilkinson CJ, Mayor T, Mortensen P, Nigg EA, Mann M (2003) Proteomic characterization of the human centrosome by protein correlation profiling. Nature 426: 570–574 - PubMed
-
- Antoniades I, Stylianou P, Skourides PA (2014) Making the connection: ciliary adhesion complexes anchor basal bodies to the actin cytoskeleton. Dev Cell 28: 70–80 - PubMed
-
- Assis LHP, Silva‐Junior RMP, Dolce LG, Alborghetti MR, Honorato RV, Nascimento AFZ, Melo‐Hanchuk TD, Trindade DM, Tonoli CCC, Santos CT, Oliveira PSL, Larson RE, Kobarg J, Espreafico EM, Giuseppe PO, Murakami MT (2017) The molecular motor Myosin Va interacts with the cilia‐centrosomal protein RPGRIP1L. Sci Rep 7: 43692 - PMC - PubMed
Publication types
MeSH terms
Substances
LinkOut - more resources
Full Text Sources
