Meta-Analysis
. 2019 Mar 22;10(1):1332.
doi: 10.1038/s41467-019-09258-y.

Meta-analysis shows positive effects of plant diversity on microbial biomass and respiration

Affiliations
Meta-Analysis

Meta-analysis shows positive effects of plant diversity on microbial biomass and respiration

Chen Chen et al. Nat Commun. .

Abstract

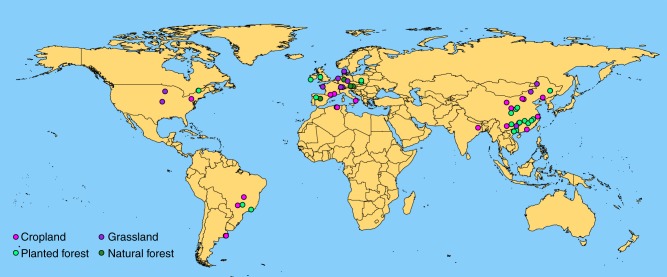
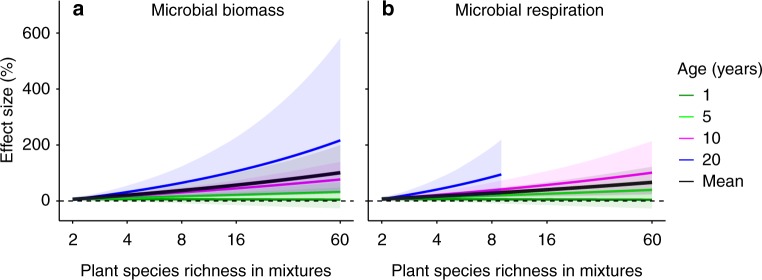
Soil microorganisms are key to biological diversity and many ecosystem processes in terrestrial ecosystems. Despite the current alarming loss of plant diversity, it is unclear how plant species diversity affects soil microorganisms. By conducting a global meta-analysis with paired observations of plant mixtures and monocultures from 106 studies, we show that microbial biomass, bacterial biomass, fungal biomass, fungi:bacteria ratio, and microbial respiration increase, while Gram-positive to Gram-negative bacteria ratio decrease in response to plant mixtures. The increases in microbial biomass and respiration are more pronounced in older and more diverse mixtures. The effects of plant mixtures on all microbial attributes are consistent across ecosystem types including natural forests, planted forests, planted grasslands, croplands, and planted containers. Our study underlines strong relationships between plant diversity and soil microorganisms across global terrestrial ecosystems and suggests the importance of plant diversity in maintaining belowground ecosystem functioning.


Conflict of interest statement

The authors declare no competing interests.

Figures

Fig. 1
Fig. 1
Global distribution of study sites in the meta-analysis. Magenta, purple, green and dark green points indicate study sites at croplands, grasslands, planted forests and natural forests. Experiments using planted containers were not included in this figure. Source data are provided as a Source Data file
Fig. 2
Fig. 2
Comparison of soil microbial attributes in plant mixtures versus monocultures. The effects represent the increase or decrease (%) of a given microbial attribute compared to the corresponding mean of constituent monocultures at the mean species richness and mean stand age in mixtures (see Methods). Values are mean ± 95% confidence intervals of the percentage effects between the plant mixtures and monocultures. The number of observations is shown beside each attribute without parentheses with the number of studies in parentheses. G+:G− represents Gram-positive bacteria and Gram-negative bacteria biomass ratio. Source data are provided as a Source Data file
Fig. 3
Fig. 3
The effects of plant mixtures on microbial attributes in relation to plant species richness and stand age. a The plant species richness (log scale) in mixtures. b Stand age (years). The effects represent the estimated coefficients of the species richness in mixtures and stand age. Values (estimated β1 and β2 in Equation (3), respectively, see Methods) are mean ± 95% confidence intervals. G+:G− represents Gram-positive and Gram-negative bacteria biomass ratio. Source data are provided as a Source Data file
Fig. 4
Fig. 4
The interactive effects of the plant species richness in mixtures and stand age on microbial attributes. a Microbial biomass. b Microbial respiration. The effects are quantified as the percent changes in mixtures compared to the corresponding mean value of constituent monocultures. Lines are fitted age-dependent regressions with 95% confidence intervals in shade. Dark green, green, magenta, blue and black lines indicate stand age at 1, 5, 10 and 20 years and mean stand age across all observations. Source data are provided as a Source Data file
Fig. 5
Fig. 5
Predicted responses of microbial attributes to a range of plant species richness reductions. a Microbial biomass. b Microbial respiration. Yellow, orange, red and dark red lines indicate plant species richness reduction at 10, 20, 40 and 80%. Source data are provided as a Source Data file

References

    1. Bardgett RD, van der Putten WH. Belowground biodiversity and ecosystem functioning. Nature. 2014;515:505–511. doi: 10.1038/nature13855. - DOI - PubMed
    1. Karhu K, et al. Temperature sensitivity of soil respiration rates enhanced by microbial community response. Nature. 2014;513:81–84. doi: 10.1038/nature13604. - DOI - PubMed
    1. Delgado-Baquerizo M, et al. A global atlas of the dominant bacteria found in soil. Science. 2018;359:320–325. doi: 10.1126/science.aap9516. - DOI - PubMed
    1. Naeem S, Hahn DR, Schuurman G. Producer-decomposer co-dependency influences biodiversity effects. Nature. 2000;403:762–764. doi: 10.1038/35001568. - DOI - PubMed
    1. Tilman D, Lehman C. Human-caused environmental change: impacts on plant diversity and evolution. Proc. Natl Acad. Sci. USA. 2001;98:5433–5440. doi: 10.1073/pnas.091093198. - DOI - PMC - PubMed

Publication types