. 2019 Mar 22;10(1):1326.
doi: 10.1038/s41467-019-09152-7.

Sterol regulatory element binding protein 1 couples mechanical cues and lipid metabolism

Affiliations

Sterol regulatory element binding protein 1 couples mechanical cues and lipid metabolism

Rebecca Bertolio et al. Nat Commun. .

Abstract

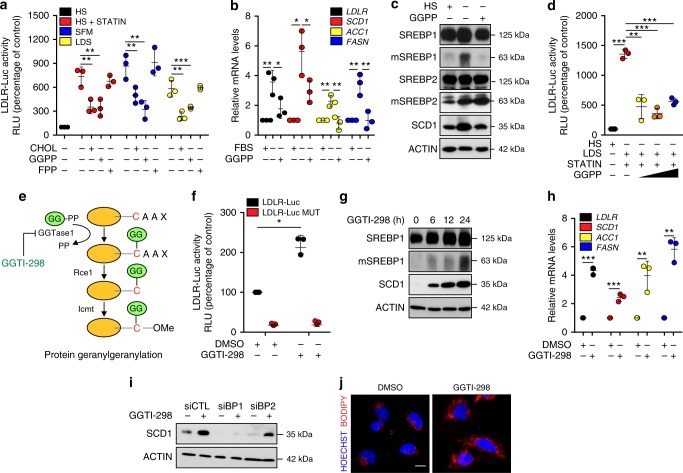
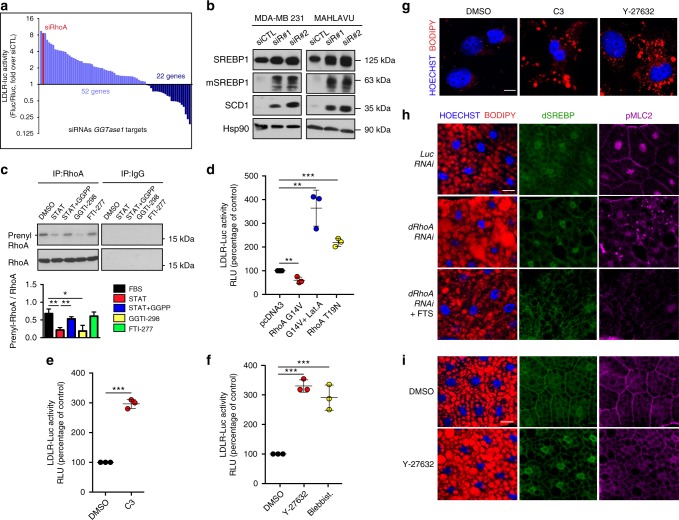
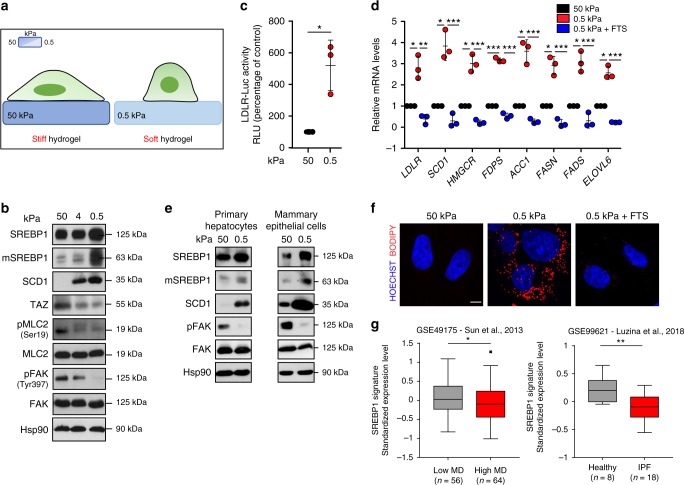
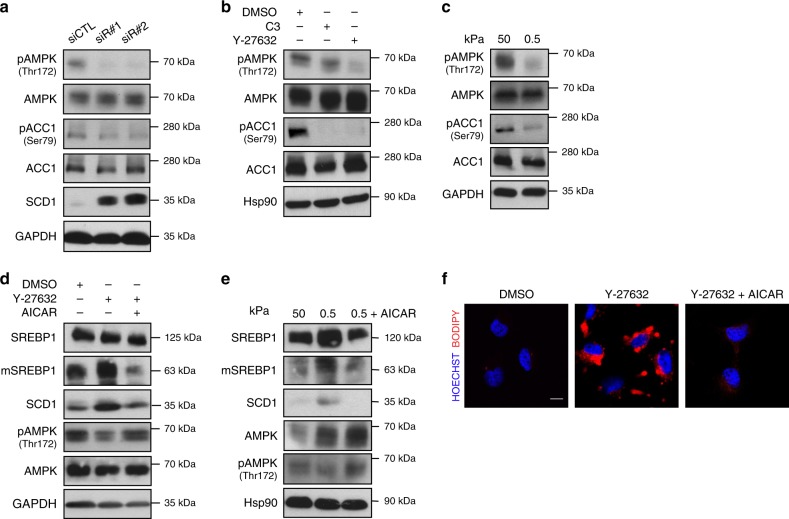
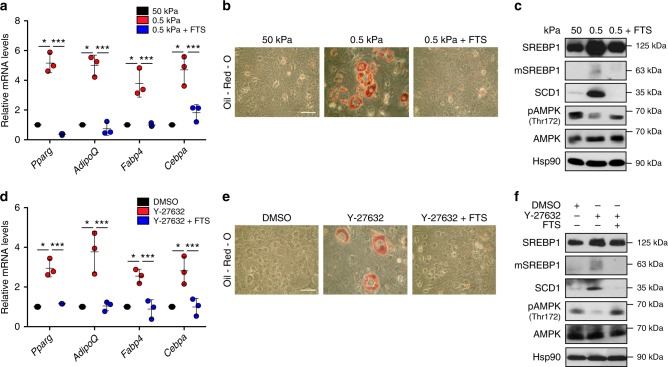
Sterol regulatory element binding proteins (SREBPs) are a family of transcription factors that regulate lipid biosynthesis and adipogenesis by controlling the expression of several enzymes required for cholesterol, fatty acid, triacylglycerol and phospholipid synthesis. In vertebrates, SREBP activation is mainly controlled by a complex and well-characterized feedback mechanism mediated by cholesterol, a crucial bio-product of the SREBP-activated mevalonate pathway. In this work, we identified acto-myosin contractility and mechanical forces imposed by the extracellular matrix (ECM) as SREBP1 regulators. SREBP1 control by mechanical cues depends on geranylgeranyl pyrophosphate, another key bio-product of the mevalonate pathway, and impacts on stem cell fate in mouse and on fat storage in Drosophila. Mechanistically, we show that activation of AMP-activated protein kinase (AMPK) by ECM stiffening and geranylgeranylated RhoA-dependent acto-myosin contraction inhibits SREBP1 activation. Our results unveil an unpredicted and evolutionary conserved role of SREBP1 in rewiring cell metabolism in response to mechanical cues.


Conflict of interest statement

The authors declare no competing interests.

Figures

Fig. 1
Fig. 1
Protein geranylgeranylation regulates SREBP1. a Low density lipoprotein receptor promoter-luciferase (LDLR-Luc) assay in MCF-10A cells. Medium containing 5% horse serum (HS, as control) was replaced with 5% HS medium supplemented with 10 μM cerivastatin (STATIN), serum-free medium (SFM) or 2% lipid serum (lipid-depleted serum, LDS) medium, for 24 h. Cells were either mock-treated, or treated with cholesterol (CHOL), geranylgeranyl pyrophosphate (GGPP) or farnesyl pyrophosphate (FPP). b RT-qPCR quantification of LDLR, SCD1, ACC1 and FASN gene expression in MCF-10A cells. c Western blot analysis of MCF-10A cells. d LDLR-Luc assay in MCF-10A cells. 5% HS medium (control) was replaced with medium supplemented with 2% LDS and 1 μM cerivastatin (STATIN), and increasing doses of GGPP (20, 40 and 100 μM) for 24 h. e Scheme of geranylgeranyl (GG) conjugation to cysteine. f LDLR-Luc assay in MCF-10A cells treated with DMSO as control or geranylgeranyl pyrophosphate transferase I inhibitor (GGTI-298). Cells transfected with the mutated construct LDLR-Luc MUT underwent the same treatments. g Western blot analysis of MCF-10A cells treated with GGTI-298 for the indicated time (hours, h). h RT-qPCR quantification of LDLR, SCD1, ACC1 and FASN gene expression in MCF-10A cells treated with DMSO as control or GGTI-298. i Western blot analysis of MCF-10A cells transfected with control (siCTL) SREBP1 (siBP1) and SREBP2 (siBP2) siRNAs and treated with GGTI-298 for 24 h. j BODIPY 493/503 staining of lipid droplets (in red) in Mahlavu cells treated with GGTI-298. Nuclei were stained with HOECHST (in blue). Scale bar, 15 μm. Graph bars represent mean ± s.d. of n = 3 biological replicates. Values in (a, b and f) are expressed as Relative Luminometer Units (RLU). Values in (b and h) are expressed as mRNA levels relative to control. In (b, c) 5% HS medium (control) was replaced with SFM or SFM supplemented with GGPP for 24 h. For western blots, ACTIN was used as loading control, mSREBP indicates mature protein. Blots and images are representative of n = 3 biological replicates. P value: *P < 0.05, **P < 0.01, ***P < 0.001 by two-tailed Student’s t-test for all analyses
Fig. 2
Fig. 2
RhoA and acto-myosin regulate the activity of hSREBP1 and dSREBP. a Screening of low density lipoprotein receptor promoter-luciferase activity in MDA-MB-231 cells transfected with constructs expressing firefly (LDLR-Luc) and renilla (Rluc) luciferase and either control siRNA (siCTL) or siRNAs targeting genes encoding geranylgeranyl pyrophosphate transferase I (GGTase1) protein substrates. b Western blot analysis of MDA-MB-231 and Mahlavu cells 48 h after transfection with siCTL or RhoA targeting siRNAs (siR#1 and siR#2). Hsp90 was used as loading control. mSREBP indicates mature protein. c Western blot analyses of immunoprecipitated (IP) RhoA in MCF-10A cells treated DMSO (as control), 1 μM cerivastatin (STAT), 1 μM cerivastatin and 20 μM GGPP (STAT+GGPP), 5 μM GGTI-298 or 5 μM FTI-277. IgGs were used as IP control. d LDLR-Luc assay in MCF-10A cells 12 h after transfection with pcDNA3-GFP control plasmid, pcDNA3-GFP-RhoA G14V construct with a 6 h DMSO treatment, pcDNA3-GFP-RhoA G14V construct with a 6 h Latrunculin A (G14V + Lat.A) treatment, or pcDNA3-GFP-RhoA T19N construct. e LDLR-Luc assay in MCF-10A cells treated with either DMSO as control or C3 for 24 h. f LDLR-Luc assay in MCF-10A cells treated with either DMSO as control, Y-27632, or Blebbistatin (Blebbist.) for 24 h. g BODIPY 493/503 staining of lipid droplets (in red) in Mahlavu cells treated with either DMSO, C3 or Y-27632 for 24 h. Scale bar, 15 μm. h, i BODIPY 493/503 staining of lipid droplets (in red) and immunofluorescence analysis of dSREBP (in green) and phosphorylated myosin light chain (pMLC2, in magenta) in Drosophila larval fat body from h flies expressing either Luciferase or dRhoA RNAi, or dRhoA RNAi and treated with fatostatin (FTS) and i wild-type flies treated with either DMSO or Y-27632. Scale bar, 20 μm. Graphs bars in (cf) represent mean ± s.d. of n = 3 biological replicates. Values in (df) are expressed as Relative Luminometer Units (RLU). Nuclei in (hi) were stained with HOECHST (in blue). Blots and images are representative of n = 3 biological replicates. P value: *P < 0.05, **P < 0.01, ***P < 0.001 by two-tailed Student’s t-test for all analyses
Fig. 3
Fig. 3
SREBP1 is under the control of mechanical cues. a Scheme of cell (in green) adhesion to fibronectin-coated hydrogel matrix (in blue) with 50 and 0.5 kPa elastic modulus. b Western blot analysis of MCF-10A cells cultured on fibronectin-coated hydrogel matrix of high (50 kPa elastic modulus), intermediate (4 kPa elastic modulus) or low (0.5 kPa elastic modulus) stiffness, for 24 h. c Low density lipoprotein receptor promoter-luciferase (LDLR-Luc) assay in MCF-10A cells cultured on stiff (50 kPa elastic modulus, as control) or soft (0.5 kPa elastic modulus) fibronectin-coated hydrogel matrix for 24 h. d RT-qPCR quantification of the expression of the indicated genes in MCF-10A cells cultured on stiff (50 kPa elastic modulus, as control) or soft (0.5 kPa elastic modulus) fibronectin-coated hydrogel matrix, or soft (0.5 kPa elastic modulus) fibronectin-coated hydrogel matrix with fatostatin treatment (FTS), for 24 h. e Western blot analysis of primary cultures of hepatocytes and mammary epithelial cells on stiff (50 kPa elastic modulus) or soft (0.5 kPa elastic modulus) fibronectin-coated hydrogel matrix for 24 h. f BODIPY 493/503 staining of lipid droplets (in red) in Mahlavu cells cultured on stiff (50 kPa elastic modulus, as control, in black) or soft (0.5 kPa elastic modulus, in red) fibronectin-coated hydrogel matrix, or soft (0.5 kPa elastic modulus) fibronectin-coated hydrogel matrix with fatostatin treatment (FTS, in blue), for 24 h. Nuclei were stained with HOECHST (in blue). Scale bar, 10 μm. g Average standardized expression levels of SREBP1 signature in human samples datasets of normal breast tissue with high vs low mammographic density (MD) and Idiopathic Pulmonary Fibrosis (IPF) patients vs healthy controls. Graphs bars represent mean ± s.d. of n = 3 biological replicates. P value: *P < 0.05 by two-tailed Student’s t-test (c, d) and two-way ANOVA (g). For western blots, Hsp90 was used as loading control, mSREBP indicates mature protein. Blots and images are representative of n = 3 biological replicates
Fig. 4
Fig. 4
AMPK suppresses SREBP1 activation downstream of mechanical inputs. a Western blot analysis of MCF-10A cells 48 h after transfection with either control (siCTL) or RhoA targeting siRNA (siR#1 and siR#2). GAPDH was used as loading control. b Western blot analysis of MCF-10A cells treated with either DMSO, C3 or Y-27632, for 24 h. Hsp90 was used as loading control. c Western blot analysis MCF-10A cells cultured on either stiff (50 kPa elastic modulus) or soft (0.5 kPa elastic modulus) fibronectin-coated hydrogel matrix for 24 h. GAPDH was used as loading control. d Western blot analysis of MCF-10A cells treated with either DMSO, Y-27632 or AICAR, for 24 h. GAPDH was used as loading control. e Western blot analysis of MCF-10A cells cultured on either stiff (50 kPa elastic modulus) or soft (0.5 kPa elastic modulus) fibronectin-coated hydrogel matrix, or soft (0.5 kPa elastic modulus) fibronectin-coated hydrogel matrix with AICAR treatment, for 24 h. Hsp90 was used as loading control. f BODIPY 493/503 staining of lipid droplets (in red) in Mahlavu cells treated with Y-27632 or Y-27632 and AICAR, for 24 h. Nuclei were stained with HOECHST (in blue). Scale bar, 15 μm. For western blots, mSREBP indicates mature protein. Blots and images are representative of n = 3 biological replicates
Fig. 5
Fig. 5
SREBP1 regulates mesenchymal stem cell commitment upon cytoskeleton remodelling. a RT-qPCR quantification of the indicated genes in mouse mesenchymal stem cells (mMSCs) cultured on stiff (50 kPa elastic modulus, as control) or soft (0.5 kPa elastic modulus) fibronectin-coated hydrogel matrix, or soft (0.5 kPa elastic modulus) fibronectin-coated hydrogel matrix with fatostatin treatment (FTS). Values are expressed as mRNA levels relative to control. b Oil-Red-O staining of lipid droplets (in red) in mMSCs cultured on either stiff (50 kPa elastic modulus) or soft (0.5 kPa elastic modulus) fibronectin-coated hydrogel matrix, or soft (0.5 kPa elastic modulus) fibronectin-coated hydrogel matrix with fatostatin treatment (FTS). Scale bar, 100 μm. c Western blot analysis of mMSCs cultured on either stiff (50 kPa elastic modulus) or soft (0.5 kPa elastic modulus) fibronectin-coated hydrogel matrix, or soft (0.5 kPa elastic modulus) fibronectin-coated hydrogel matrix with fatostatin treatment (FTS). d RT-qPCR quantification of the indicated genes in mMSCs cultured in differentiating medium and treated with either DMSO as control, or with Y-27632, or Y-27632 and fatostatin (Y-27632 + FTS). Values are expressed as mRNA levels relative to control. e Oil-Red-O staining of lipid droplets (in red) in mMSCs cultured in differentiating medium and treated with DMSO as control, or with Y-27632 or Y-27632 and fatostatin (Y-27632+FTS). Medium composition is detailed in the Methods section. Scale bar, 100 μm. f Western blot analysis of mMSC cultured in differentiating medium and treated with either DMSO as control or with Y-27632, or Y-27632 and fatostatin (FTS). Graph bars represent mean ± s.d. of n = 3 biological replicates. For western blots, Hsp90 was used as loading control, mSREBP indicates mature protein. P value: *P < 0.05, ***P < 0.001 by two-tailed paired Student’s t-test. Blots and images are representative of n = 3 biological replicates

Similar articles

Cited by

References

    1. Horton JD, Goldstein JL, Brown MS. Critical review SREBPs: activators of the complete program of cholesterol and fatty acid synthesis in the liver. J. Clin. Invest. 2002;109:1125–1131. doi: 10.1172/JCI0215593. - DOI - PMC - PubMed
    1. Shimano H, Sato R. SREBP-regulated lipid metabolism: convergent physiology—divergent pathophysiology. Nat. Rev. Endocrinol. 2017;13:710–730. doi: 10.1038/nrendo.2017.91. - DOI - PubMed
    1. Brown MS, Goldstein JL. The SREBP pathway: regulation of cholesterol metabolism by proteolysis of a membrane-bound transcription factor. Cell. 1997;89:331–340. doi: 10.1016/S0092-8674(00)80213-5. - DOI - PubMed
    1. Osborne TF, Espenshade PJ. Evolutionary conservation and adaptation in the mechanism that regulates SREBP action: What a long, strange tRIP it’s been. Genes Dev. 2009;23:2578–2591. doi: 10.1101/gad.1854309. - DOI - PMC - PubMed
    1. Hannah VC, Ou J, Luong A, Goldstein JL, Brown MS. Unsaturated fatty acids downregulate SREBP isoforms 1a and 1c by two mechanisms in HEK-293 Cells. J. Biol. Chem. 2001;276:4365–4372. doi: 10.1074/jbc.M007273200. - DOI - PubMed

Publication types