. 2019 Mar 22;10(1):1333.
doi: 10.1038/s41467-019-09307-6.

Dissecting heterogeneity in malignant pleural mesothelioma through histo-molecular gradients for clinical applications

Affiliations

Dissecting heterogeneity in malignant pleural mesothelioma through histo-molecular gradients for clinical applications

Yuna Blum et al. Nat Commun. .

Abstract

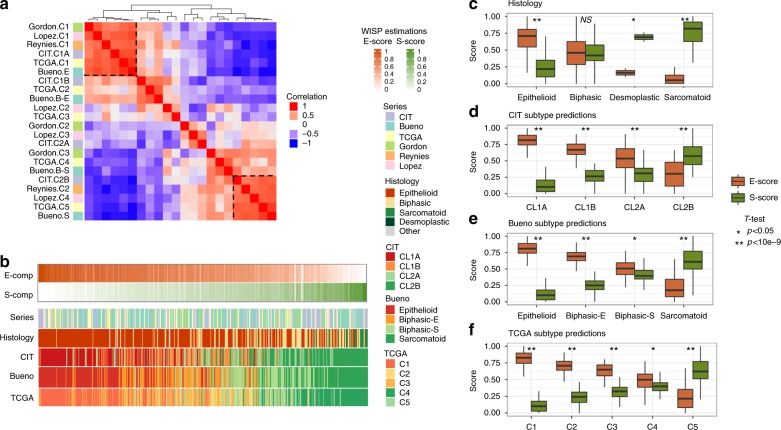
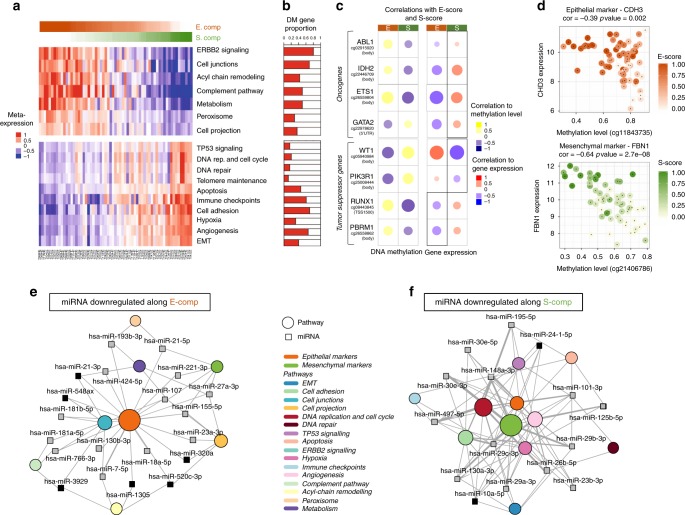
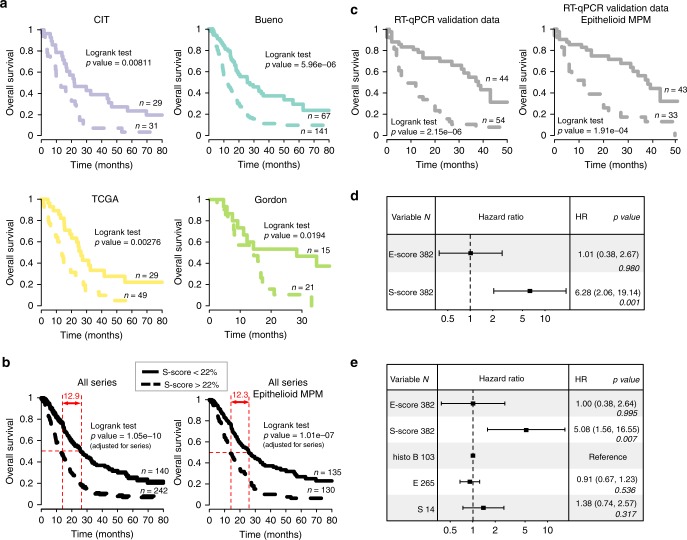
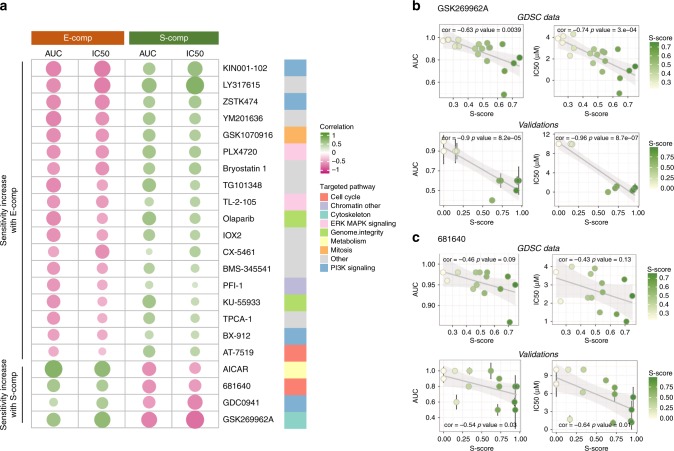
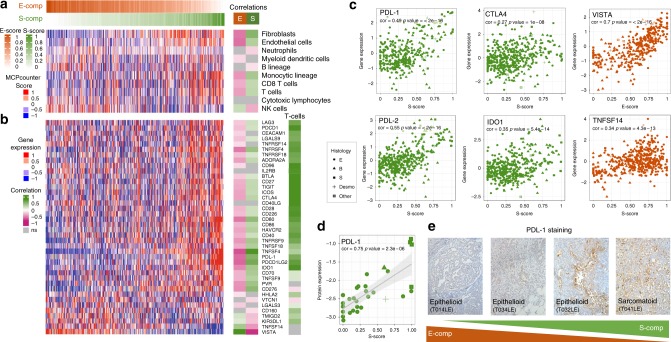
Malignant pleural mesothelioma (MPM) is recognized as heterogeneous based both on histology and molecular profiling. Histology addresses inter-tumor and intra-tumor heterogeneity in MPM and describes three major types: epithelioid, sarcomatoid and biphasic, a combination of the former two types. Molecular profiling studies have not addressed intra-tumor heterogeneity in MPM to date. Here, we use a deconvolution approach and show that molecular gradients shed new light on the intra-tumor heterogeneity of MPM, leading to a reconsideration of MPM molecular classifications. We show that each tumor can be decomposed as a combination of epithelioid-like and sarcomatoid-like components whose proportions are highly associated with the prognosis. Moreover, we show that this more subtle way of characterizing MPM heterogeneity provides a better understanding of the underlying oncogenic pathways and the related epigenetic regulation and immune and stromal contexts. We discuss the implications of these findings for guiding therapeutic strategies, particularly immunotherapies and targeted therapies.


Conflict of interest statement

The authors declare no competing interests.

Figures

Fig. 1
Fig. 1
Meta-analysis and molecular gradients. a Correlation matrix of centroid profiles of all clusters from the different classifications. b Estimation of the E-score and S-score and classification subtype predictions in all available tumor tissue samples (442 samples). The samples were ordered based on their E-score and S-score ratios. cf Boxplots of the E-score and S-score according to the histology results (c), CIT subtype predictions (d), Bueno subtype predictions (e), and TCGA subtype predictions (f). Significance in the T-test comparing the E-score and S-score in each modality is shown (*P value < 0.05, **P value < 10e−9, NS, not significant). For all boxplots (c, d, e, f), bottom and top of boxes are the first and third quartiles of the data, respectively, and whiskers represent the lowest (respectively highest) data point still within 1.5 interquartile range of the lower (respectively upper) quartile. Center line represents the median value
Fig. 2
Fig. 2
Component-specific pathways and epigenetic regulation. a Expression heatmap of the component-specific pathways (P value < 0.05, Fisher’s exact test). For each pathway, the mean expression profile of the associated deregulated genes was calculated. Samples were ordered by the ratio of rescaled E-score and S-score. b Lateral bars correspond to each pathway and to the proportion of genes whose expression levels were correlated with the DNA methylation level (DM, differentially methylated). c Heatmap of the correlations between DNA methylation and gene expression with the E-score and S-score for known oncogenes and tumor suppressor genes (FDR adjusted P value < 0.05, Pearson’s correlation test). The circle size is proportional to the correlation coefficient value. d Correlation plots between the DNA methylation level and the CDH3 (epithelial marker) and FBN1 (mesenchymal marker) gene expression levels; color gradient changes correspond to the E-score or S-score. For each plot, the correlation coefficient and P value are shown (Pearson’s correlation test). e, f The network displays miRNAs whose expression levels are negatively correlated with the E-score (e) or S-score (f) and their targeted pathways (among the component-specific pathways between E-comp and S-comp) based on validated miRNA-target associations. The network was restricted to miRNAs that were negatively correlated with the expression of their target (FDR adjusted P value < 0.05, Pearson’s correlation test) and targeted at least 2 (e) out of 5 (f) different component-specific pathways. The edge thickness is proportional to the number of genes in the pathway targeted by the miRNA. The circle size of each pathway is proportional to the number of genes targeted by the miRNA in the network. miRNAs that have been described in the MPM literature are represented by a gray square, and undescribed miRNAs are represented by a black square
Fig. 3
Fig. 3
Prognostic impact of the S-score. Overall survival curve plots for patients with less than 22% of S-score (plain curve) or more than 22% of S-score (dashed curve) in samples in the CIT, Bueno, TCGA, and Gordon series (a), all samples from the different series or the series restricted to epithelioid MPM (b), and our qRT-PCR validation dataset (c). Difference in median overall survival between patients with less or more 22% of S-score is indicated in red (b). The P values are based on a log-rank test and adjusted for the series when appropriate, and the number of patients (n) is indicated in each condition. d, e Forest plots of the overall survival hazard ratios (HRs) estimated using a multivariate Cox analysis adjusted for the series, integrating the E-score, S-score (d) and the histological types (e) for MPM samples from the CIT, Bueno, TCGA and Gordon series. The hazard ratios, 95% confidence intervals (CIs) and related Wald test P values are given for both components
Fig. 4
Fig. 4
Association with drug sensitivity. a Heatmap of the correlations between the AUC and IC50 and E-score and S-score for the drugs included in the GDSC database with at least one significant correlation with the components (P value < 0.05). The circle size is proportional to the correlation value. The drugs are ordered on either side by their negative correlations with the E-score or S-score, which corresponded to a sensitivity increase along the component. The signaling pathways targeted by these inhibitors are mentioned on the right. b, c AUC and IC50 plots (error bars correspond to s.d.) obtained from the GDSC data or determined from our validation experiments vs. the S-score for GSK269962A (b) and 681640 (c). The color gradient represents the range of S-score. For each plot, the correlation coefficient and P value are shown (Pearson’s correlation test)
Fig. 5
Fig. 5
Specific immune landscape. a, b Heatmaps showing quantification of immune and stromal populations computed by MCP-counter from transcriptomic data (a) and immune checkpoint (ICK) gene expression (b), along E-comp and S-comp. The lateral red-green heatmap displays correlation coefficient values between the corresponding features and the E-score or S-score and between ICK and the T cell infiltration score. Non-significant correlations (P value > 0.05, Pearson’s correlation test) are represented in gray. c, d Gene expression plots for different immune checkpoints (PDL1, PDL2, CTLA4, TNFSF14, and VISTA) and one checkpoint modulator (IDO1) (c) and the plots of PDL-1 protein expression (RPPA data) (d) vs. the E-score or S-score. For each plot, the correlation and P value are shown (Pearson’s correlation test). The point shapes correspond to the different MPM histologies: epithelioid (E), biphasic (B), sarcomatoid (S), and desmoplastic (Desmo). e Immunohistochemical staining for PDL-1 in four samples along E-comp and S-comp

References

    1. Yap TA, Aerts JG, Popat S, Fennell DA. Novel insights into mesothelioma biology and implications for therapy. Nat. Rev. Cancer. 2017;17:475–488. doi: 10.1038/nrc.2017.42. - DOI - PubMed
    1. Jean D, Daubriac J, Le Pimpec-Barthes F, Galateau-Salle F, Jaurand MC. Molecular changes in mesothelioma with an impact on prognosis and treatment. Arch. Pathol. Lab. Med. 2012;136:277–293. doi: 10.5858/arpa.2011-0215-RA. - DOI - PubMed
    1. Bueno R, et al. Comprehensive genomic analysis of malignant pleural mesothelioma identifies recurrent mutations, gene fusions and splicing alterations. Nat. Genet. 2016;48:407–416. doi: 10.1038/ng.3520. - DOI - PubMed
    1. Betta PG, Magnani C, Bensi T, Trincheri NF, Orecchia S. Immunohistochemistry and molecular diagnostics of pleural malignant mesothelioma. Arch. Pathol. Lab. Med. 2012;136:253–261. doi: 10.5858/arpa.2010-0604-RA. - DOI - PubMed
    1. Huang SX, Jaurand MC, Kamp DW, Whysner J, Hei TK. Role of mutagenicity in asbestos fiber-induced carcinogenicity and other diseases. J. Toxicol. Environ. Health B Crit. Rev. 2011;14:179–245. doi: 10.1080/10937404.2011.556051. - DOI - PMC - PubMed

Publication types

MeSH terms

Substances