. 2019 Mar 22;9(1):5027.
doi: 10.1038/s41598-019-41606-2.

Greater brain activity during the resting state and the control of activation during the performance of tasks

Affiliations

Greater brain activity during the resting state and the control of activation during the performance of tasks

Jie Huang. Sci Rep. .

Abstract

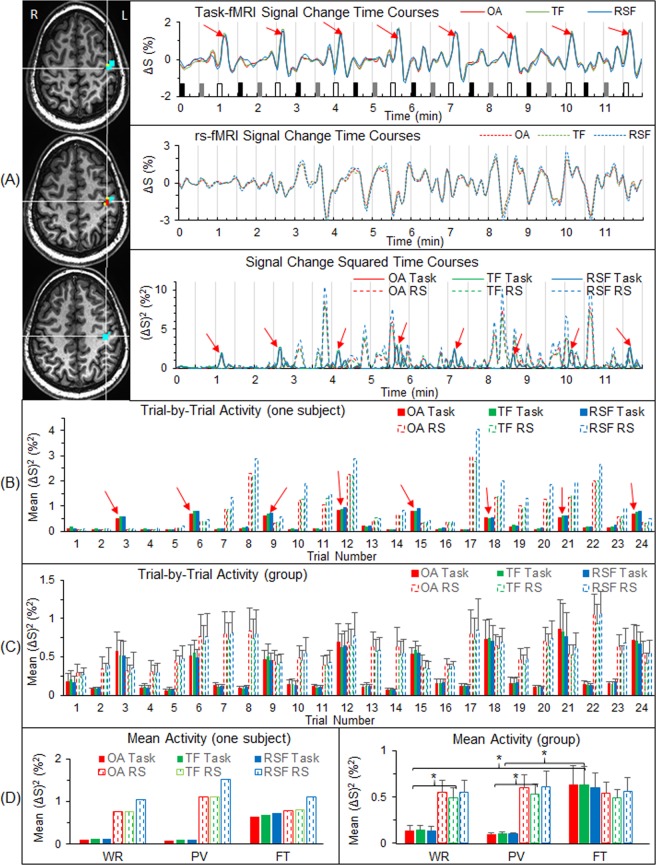
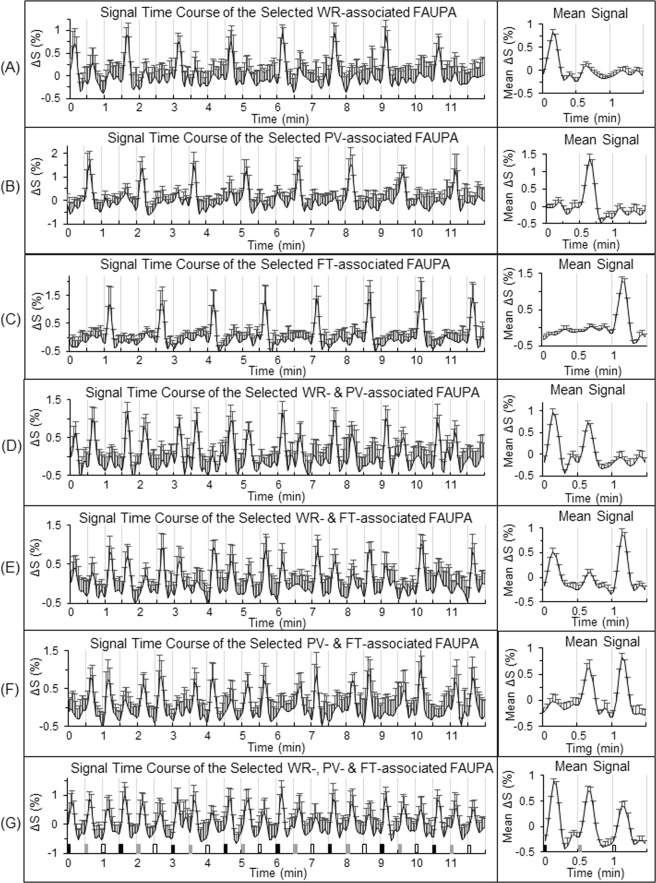
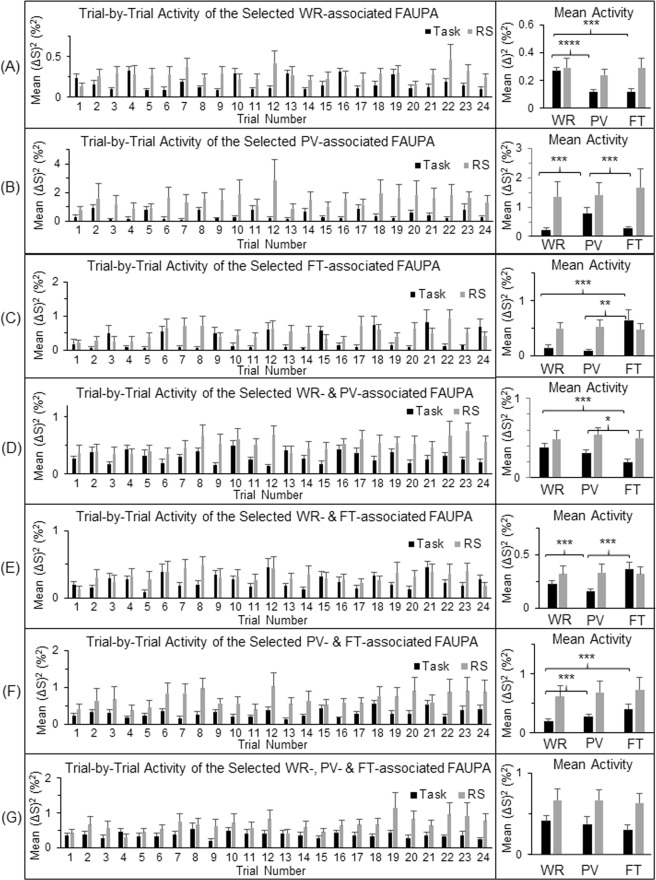
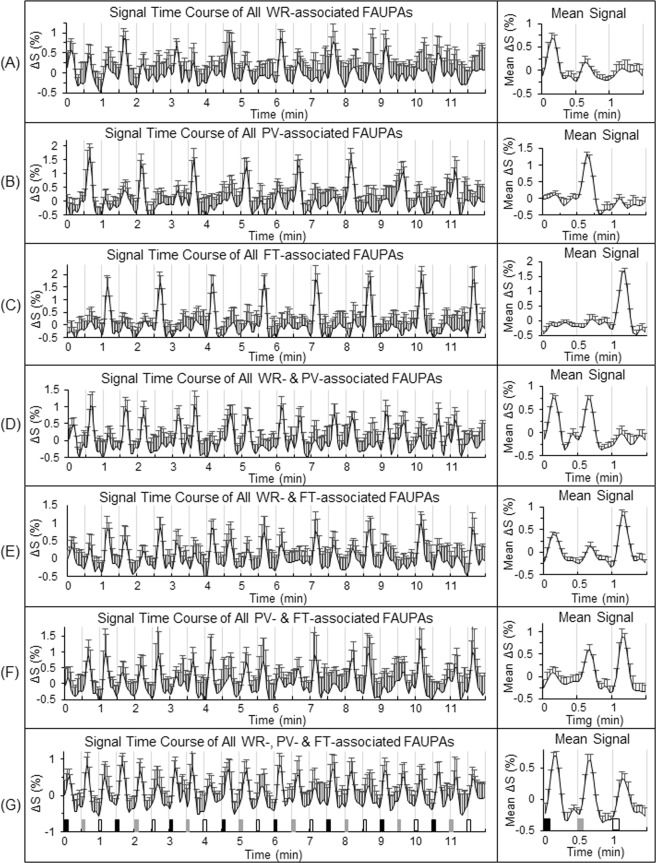
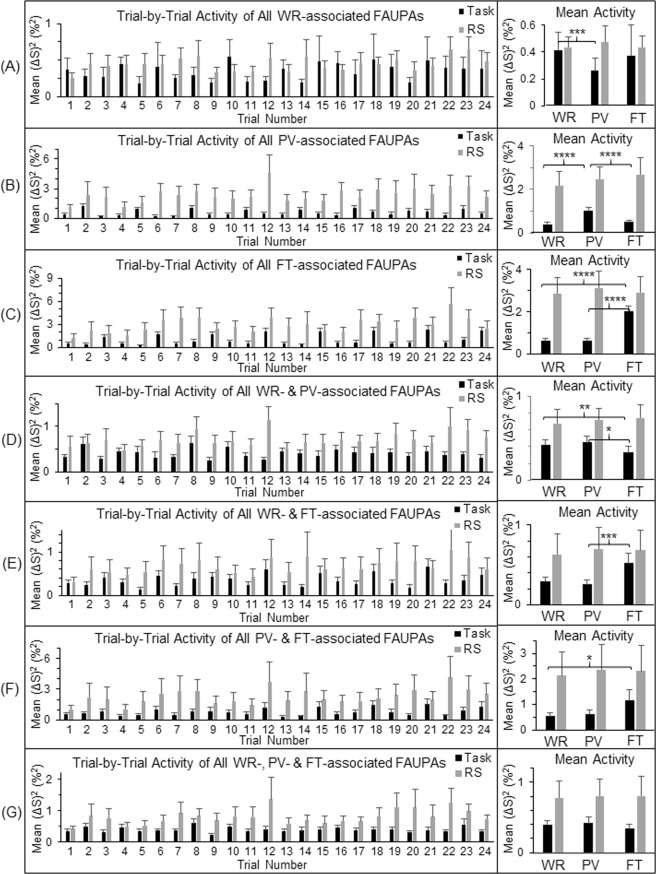
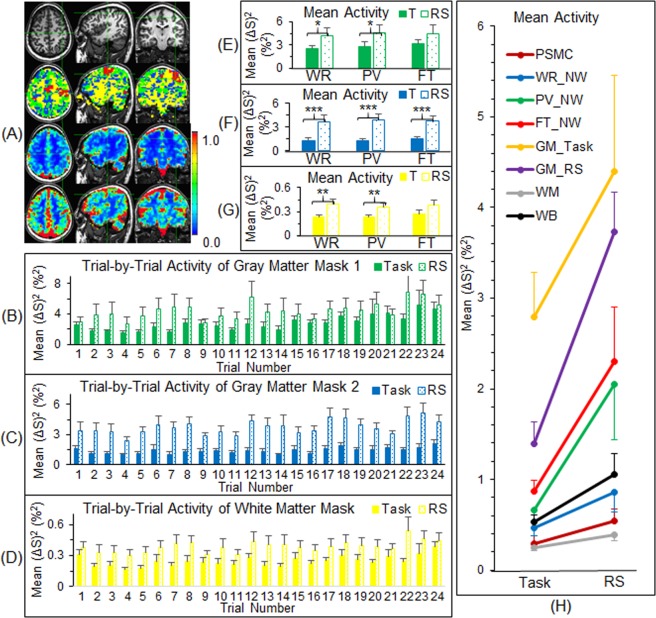
The brain's operations are mainly intrinsic, involving the acquisition and maintenance of information for interpreting, responding to and predicting environmental demands. The brain's on-going intrinsic activity (i.e., the resting-state activity) is spontaneous, but this spontaneous activity exhibits a surprising level of spatial and temporal organization across the whole brain. In this study we compared the intrinsic activity with the activity evoked by tasks, and made the comparison at several levels of analysis from a finger-tapping-activated area within the primary sensorimotor cortex to the whole brain. We found that, contrary to our intuition, the intrinsic activity was substantially larger than the task activity and consistently so for all levels of analysis. For the task state, the brain: (1) controlled the intrinsic activity not only during the performance of a task but also during the rest between tasks; (2) activated a task-specific network only when the task was performed but kept it relatively "silent" for other different tasks; and (3) simultaneously controlled the activation of all task-specific networks during the performance of each task.


Conflict of interest statement

The author declares no competing interests.

Figures

Figure 1
Figure 1
Comparison between the task activity and the intrinsic activity at the level of voxels. (A) For a representative participant, the three images show a task-fMRI FAUPA (TF) and a rs-fMRI FAUPA (RSF) with an overlapped area (OA) between them in the left primary sensorimotor cortex. The TF comprises the three yellow voxels plus the two red voxels of the OA, and the RSF comprises the fourteen cyan voxels plus the two red voxels. The three solid lines in the top panel show the time courses of the BOLD signal change of the task-fMRI for the three areas (green for TF, blue RSF and red OA) in the top plot. The task paradigm consisted of 24 trials shown by the 24 bars: black bars representing word-reading, gray bars pattern-viewing and white finger-tapping. Each task lasted 6 s followed by 24 s rest. The three dashed lines in the middle panel show the time courses of the BOLD signal change of the rs-fMRI for the three areas, and reflect the intrinsic activity in these areas during the 12-min resting-state. The bottom panel shows the time courses of the square of the BOLD signal change for both task-fMRI (solid lines) and rs-fMRI (dashed lines). Eight red arrows point out the large signal changes associated with the underlying neural activity evoked by the finger tapping task. The three dashed lines represent their corresponding time courses of the intrinsic activity measured with the rs-fMRI. (B) For the same participant, the solid bars represent the task activity averaged over each trial period for the 24 trials, and the dashed bars represent the corresponding intrinsic activity for the corresponding periods. (C) As B averaged for the nine participants. (D) As B averaged over the eight trials of each task type for the representative participant (left) and the corresponding average for the group (right). For each of the three areas (TF, RSF and OA), the intrinsic activity was significantly larger than the task activity for both WR and PV (*: paired t-test, the maximal p < 0.01). The bar indicates the corresponding standard error of the mean across the participants.
Figure 2
Figure 2
Illustration of the seven selected task-associated FAUPAs. A task-associated FAUPA is defined as a FAUPA that is activated when the task is performed. There are three tasks of WR, PV and FT in the task-fMRI, and therefore there are total of seven functional groupings (i.e., seven categories) among these three tasks as illustrated from (A) to (G). For each participant, a representative task-associated FAUPA was selected for each category. The left plot in each panel represents the time course of the group-mean signal change of the selected FAUPA for that category. For each participant, the trial-mean signal change averaged over the eight trials was computed first for the three tasks, and then the group-mean of this trial-mean signal change was compared for the three tasks (the right plot). The black, gray and white bars in (G) represent the onset and duration of WR, PV and FT, respectively. The error bar indicates the corresponding standard deviation across the participants.
Figure 3
Figure 3
Comparison of the neural activity (BOLD signal change squared) during the task-fMRI and the rs-fMRI at the level of the seven selected task-associated FAUPAs. For each of the seven functional groupings of the task-associated FAUPAs, the left plot shows the group-mean activity of the selected FAUPA from trial to trial for that category. For each participant and each category, the trial-mean activity averaged over the eight trials was computed first for the three tasks, and then the group-mean of this trial-mean activity was compared for the three tasks (the right plot). The intrinsic activity shown by the gray bars is consistently higher than the task-evoked activity throughout. The error bar indicates the corresponding standard error of the mean across the participants. *p < 0.05; **p < 0.01; ***p < 0.005; and ****p < 0.0001 (paired t-test).
Figure 4
Figure 4
Illustration of the three task-specific networks. For each of the seven functional groupings illustrated in Fig. 2, for each participant the signal time course of the selected FAUPA was used to identify all task-associated FAUPAs for the category. The left plot in each panel represents the time course of the group-mean signal change of all identified task-associated FAUPAs for that category. For each participant, the trial-mean signal change was computed first for the three tasks, and then the group-mean of this trial-mean signal change was compared for the three tasks (the right plot). They are remarkably similar as those of the seven selected task-associated FAUPAs shown in Fig. 2. These task-associated FAUPAs were distributed across the whole brain, and could be further functionally grouped to compose task-specific networks. A task-specific network is defined as a set of FAUPAs in which each FAUPA is activated when the task is performed, and accordingly, there were three task-specific networks identified for the task-fMRI. The WR-specific network, for example, consisted of task-associated FAUPAs in the four functional groupings of (A,D,E,G), the PV-specific network was composed of FAUPAs in (B,D,F,G) and the FT-specific network comprised FAUPAs in (C,E,F,G), respectively. The WR-specific network was activated when each of the eight WR tasks was performed, but the other two networks remained relatively “quiet”, implying the separation of the three networks. The same was true of the other two task-specific networks. The error bar indicates the corresponding standard deviation across the participants.
Figure 5
Figure 5
Comparison of the neural activity during the task-fMRI and the rs-fMRI at the level of the three task-specific networks. For each of the seven functional groupings of the task-associated FAUPAs, the left plot shows the group-mean activity of all identified task-associated FAUPAs from trial to trial for that category. For each participant and each functional grouping, the trial-mean activity was computed first for the three tasks, and then the group-mean of this trial-mean activity was compared for the three tasks (the right plot). For each of the three task-specific networks defined in the legend of Fig. 4, the activity from trial to trial is characterized by the corresponding activity of the four categories that compose the network. For example, the activity of the FT-specific network from trial to trial is characterized by the activity of the categories (C,E,F,G). This network was activated each time the FT task was performed but remained relatively “quiet” for both the WR and PV tasks. The intrinsic activity shown by the gray bars is consistently higher than the task-evoked activity throughout. The error bar indicates the corresponding standard error of the mean across the participants. *p < 0.05; **p < 0.01; ***p < 0.005; and ****p < 0.0001 (paired t-test).
Figure 6
Figure 6
Comparison of the neural activity between the task-fMRI and the rs-fMRI at the level of gray matter, white matter and whole brain. (A) The three images in the second row illustrate four masks represented by four colours (only three slices in the representative participant are selected for illustration): (1) the red clusters represent the network mask that consisted of the three task-specific networks; (2) the green clusters represent the first mask of the gray matter that consisted of all FAUPAs identified with the task-fMRI, excluding the network mask; (3) the blue clusters represent the second mask of the gray matter that consisted of all FAUPAs identified with the rs-fMRI, excluding all FAUPAs identified with the task-fMRI; and (4) the yellow clusters represent the white matter mask that consisted of the whole brain mask, excluding all FAUPAs identified with both task- and rs-fMRI. The images in the third row and in the last row show the overall temporal mean of the task activity and of the intrinsic activity, respectively. The colour bar represents the magnitude of activity (%2). (BD) The trial-by-trial activity for the first gray matter mask, the second gray matter mask and the white matter mask, respectively. Note that the intrinsic activity is consistently larger than the task activity throughout. (EG) The activity averaged over the eight trials for the first gray matter mask, the second gray matter mask and the white matter mask for the three tasks, respectively. (T: task; *p < 0.05; **p < 0.02; ***p < 0.0005; paired t-test.) (H) Comparison of the overall mean activity (averaged for all time points) between the task activity and the intrinsic activity from the level of voxels to the whole brain. The intrinsic activity is about twice that of the task activity at each level, and the mean and standard deviation of their relative differences were 116 ± 57 (%). PSMC: primary sensorimotor cortex; NW: network; GM: gray matter; WM: white matter; and WB: whole brain. The error bar indicates the corresponding standard error of the mean across the participants.
Figure 7
Figure 7
Comparison of the rotation and displacement between the rs- and task-fMRI scans. For the resting-state (RS) scan, the very first volume image was chosen as the base volume image (within-scan, WS), and for each of the six rigid-body co-registration parameter (three rotations and three displacements), the mean value of the absolute value of the parameter over the whole volumes was computed. Then, its corresponding group-mean value was computed and illustrated. For the task scan, we performed two assessments: (1) chosen the very first volume image of the task scan as the base (WS), and (2) chosen the very first volume image of the RS scan as the base (between-scans, BS). (A) Rotations around the three axes of the inferior-superior (roll), right-left (pitch), and anterior-posterior (yaw). |x|, the absolute value of x; deg: degree. (B) Displacements in the superior direction (dS), posterior direction (dP), and left direction (dL). The error bar indicates the corresponding standard error of the means.

References

    1. Raichle ME. Two views of brain function. Trends Cogn Sci. 2010;14:180–190. doi: 10.1016/j.tics.2010.01.008. - DOI - PubMed
    1. Biswal B, Yetkin FZ, Haughton VM, Hyde JS. Functional connectivity in the motor cortex of resting human brain using echo-planar MRI. Magn Reson Med. 1995;34:537–541. doi: 10.1002/mrm.1910340409. - DOI - PubMed
    1. Raichle ME. The restless brain. Brain Connect. 2011;1:3–12. doi: 10.1089/brain.2011.0019. - DOI - PMC - PubMed
    1. Greicius MD, et al. Persistent default-mode network connectivity during light sedation. Hum Brain Mapp. 2008;29:839–847. doi: 10.1002/hbm.20537. - DOI - PMC - PubMed
    1. Vincent JL, et al. Intrinsic functional architecture in the anaesthetized monkey brain. Nature. 2007;447:83–86. doi: 10.1038/nature05758. - DOI - PubMed

Publication types