. 2019 May;224(4):1609-1625.
doi: 10.1007/s00429-019-01858-0. Epub 2019 Mar 22.

Magnetic resonance imaging of noradrenergic neurons

Affiliations

Magnetic resonance imaging of noradrenergic neurons

Takashi Watanabe et al. Brain Struct Funct. 2019 May.

Abstract

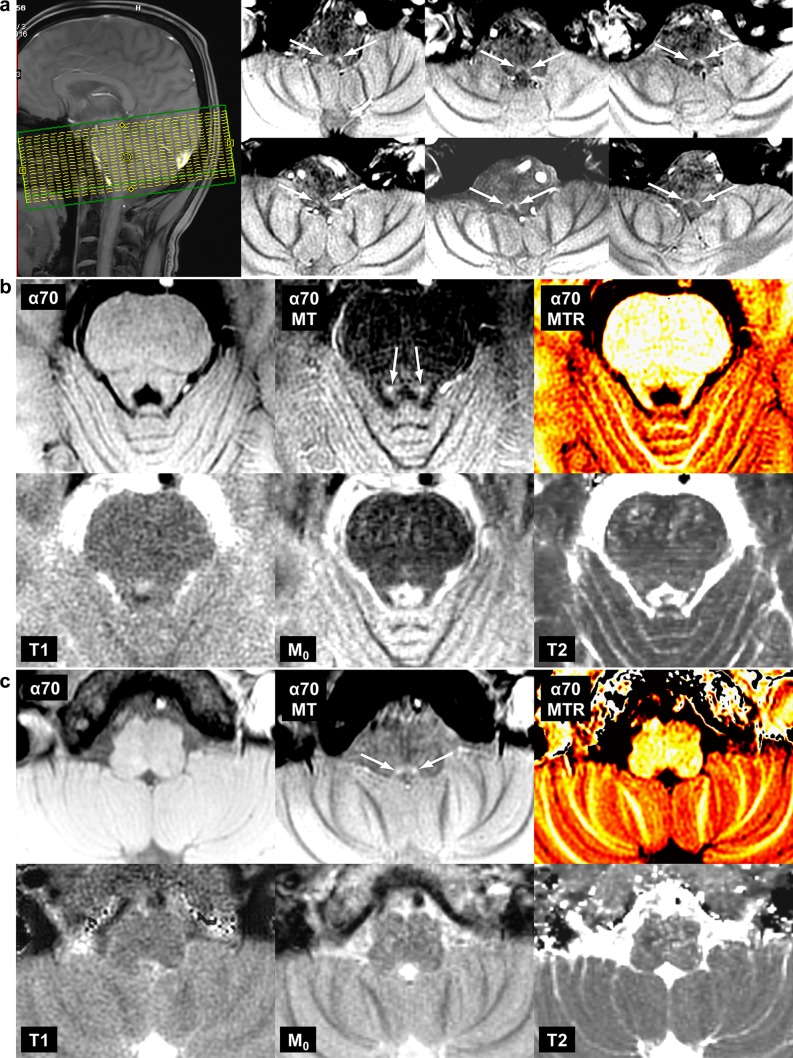
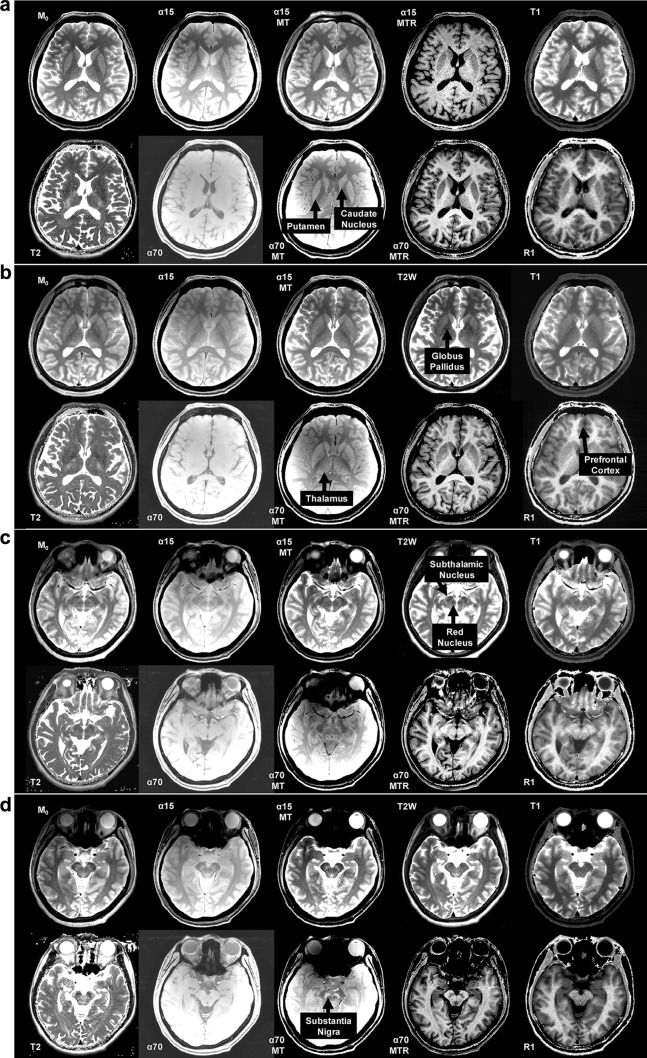
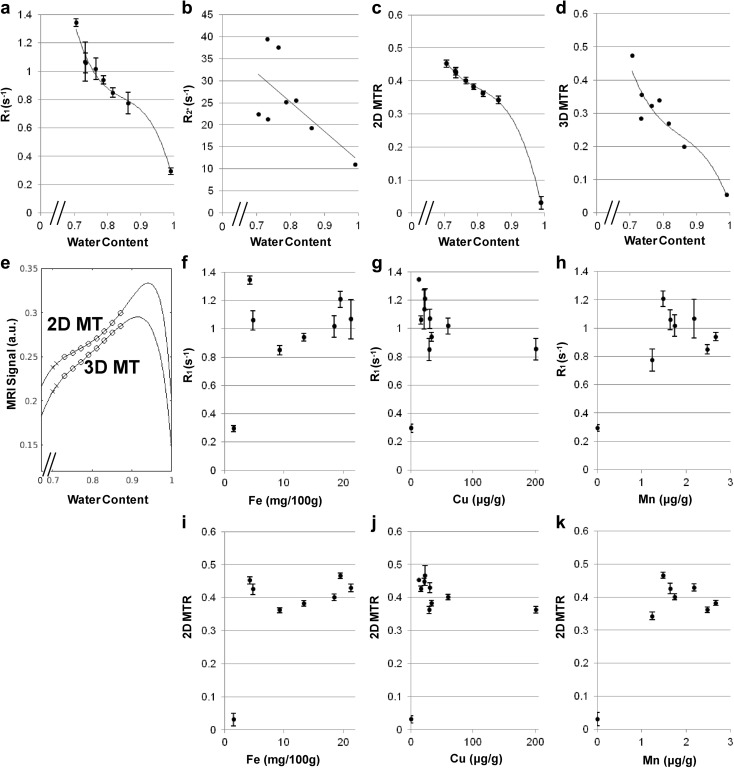
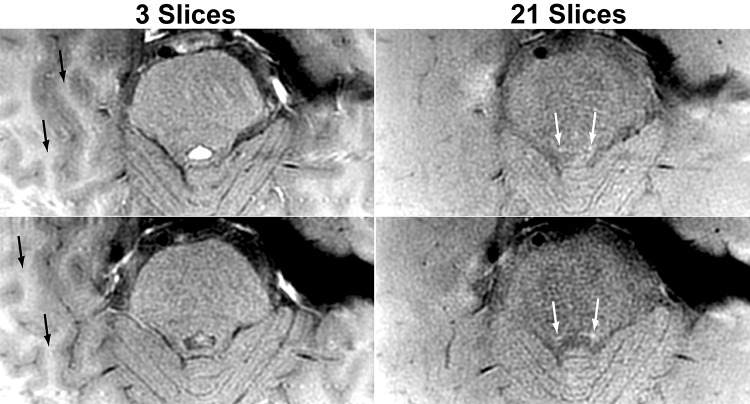
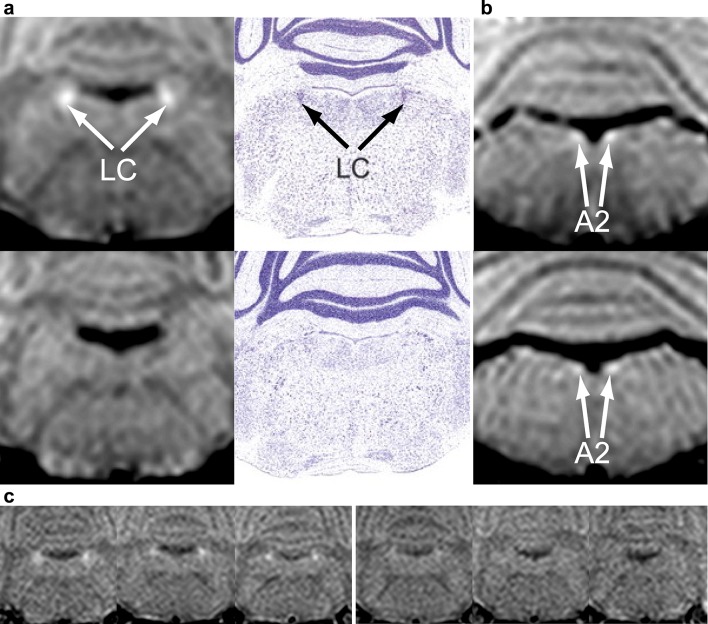
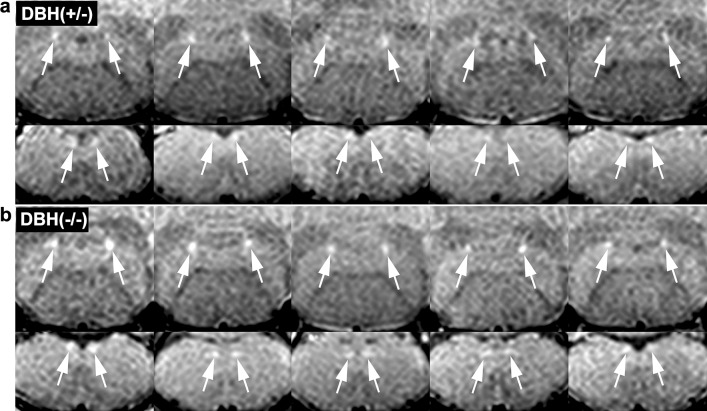
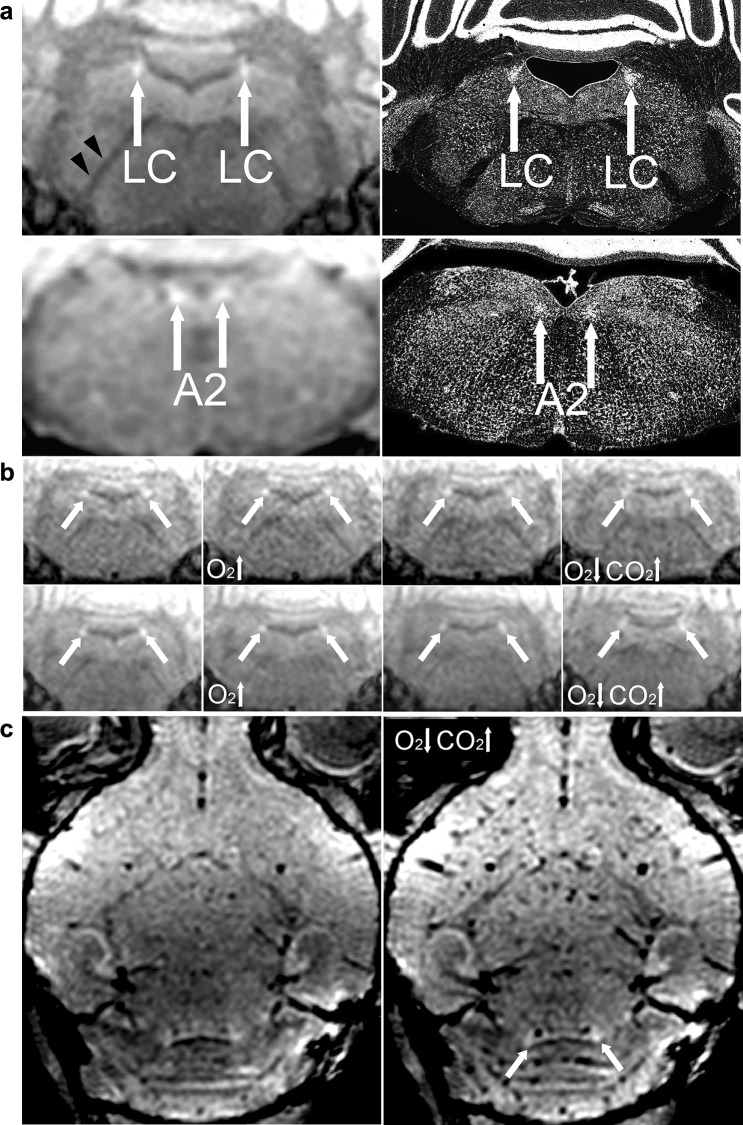
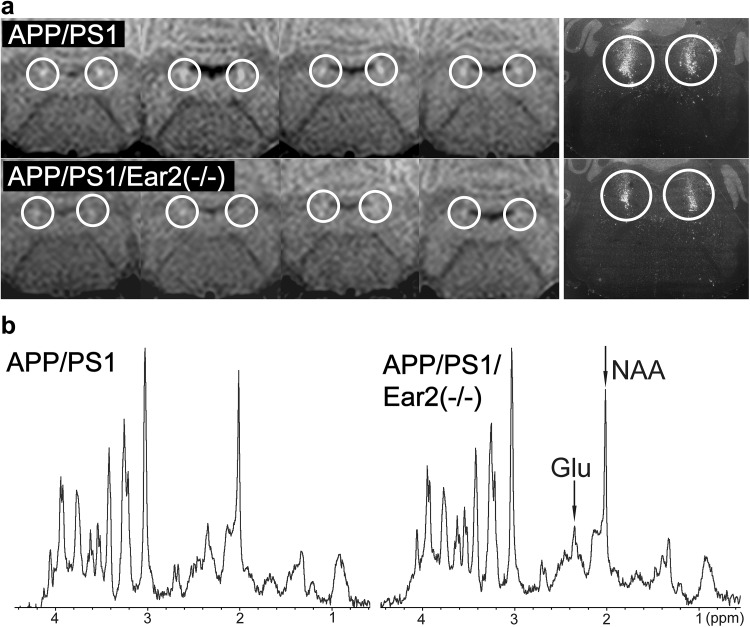
Noradrenaline is a neurotransmitter involved in general arousal, selective attention, memory, inflammation, and neurodegeneration. The purpose of this work was to delineate noradrenergic neurons in vivo by T1-weighted MRI with magnetization transfer (MT). In the brainstem of human and mice, MRI identified the locus coeruleus, dorsal motor vagus nucleus, and nucleus tractus solitarius. Given (1) the long T1 and low magnetization transfer ratio for the noradrenergic cell groups compared to other gray matter, (2) significant correlation between MT MRI signal intensity and proton density, and (3) no correlation between magnetization transfer ratio (or R1) and iron, copper, or manganese in human brain, the high MRI signal of the noradrenergic neurons must be attributed to abundant water protons interacting with any T1-shortening paramagnetic ions in active cells rather than to specific T1-shortening molecules. The absence of a high MRI signal from the locus coeruleus of Ear2(-/-) mice lacking noradrenergic neurons confirms that cell bodies of noradrenergic neurons are the source of the bright MRI appearance. The observation of this high signal in DBH(-/-) mice, in 3-week-old mice, and in mice under hyperoxia/hypercapnia/hypoxia together with the general absence of neuromelanin (NM) in noradrenergic neurons of young rodents further excludes that it is due to NM, dopamine β-hydroxylase, their binding to paramagnetic ions, blood inflow, or hemoglobin. Instead, these findings indicate a high density of water protons whose T1 is shortened by paramagnetic ions as the relevant source of the high MRI signal. In the brain of APP/PS1/Ear2(-/-) mice, a transgenic model of Alzheimer's disease, MRI detected noradrenergic neuron loss in the locus coeruleus. Proton magnetic resonance spectroscopy revealed that a 60-75% reduction of noradrenaline is responsible for a reduction of N-acetylaspartate and glutamate in the hippocampus as well as for a shortening of the water proton T2 in the frontal cortex. These results suggest that a concurrent shortage of noradrenaline in Alzheimer's disease accelerates pathologic processes such as inflammation and neuron loss.

Keywords: Alzheimer’s disease; Dorsal motor vagus nucleus; Locus coeruleus; Magnetization transfer; Neuromelanin; Nucleus tractus solitarius.


Conflict of interest statement

Conflict of interest

The authors declare that they have no competing financial interests.

Ethical standards

All procedures performed in studies involving human participants were in accordance with the ethical standards of the institutional and/or national research committee and with the 1964 Helsinki declaration and its later amendments or comparable ethical standards.

Informed consent

All participants gave written informed consent before each examination.

Human/animal rights statement

All animal experiments were performed in accordance with German animal protection laws after approval by the responsible governmental authority.

Figures

Fig. 1
Fig. 1
MRI delineates noradrenergic neuron groups in human brain in vivo. a (Left) Mid-sagittal human brain MRI illustrating the field-of-view selected for imaging the locus coeruleus and A2. (Right) Transversal MRI of A2 cell groups (arrows) in six different subjects. b Transversal T1-weighted MRI without (α70) and with MT (α70MT), MT ratio map (α70MTR), T1 map (T1), M0 map (M0), and T2 map (T2) showing the locus coeruleus (arrows) and c the A2 cell group (arrows)
Fig. 2
Fig. 2
Magnetization transfer MRI provides proton-density contrast in brain while saturating long-T1 extracellular protons. a Transversal M0 map (M0), proton-density-weighted MRI without (α15) and with MT (α15 MT), MT ratio map (α15 MTR), T1 map (T1), T2 map (T2), T1-weighted MRI without (α70) and with MT (α70 MT), MT ratio map (α70 MTR), and R1 map (R1) showing the caudate nucleus and putamen, b globus pallidus, thalamus, and prefrontal cortex, c subthalamic and red nuclei, and d substantia nigra. Note the similar contrast for M0,α15 MT, and α70 MT except for cerebrospinal fluid
Fig. 3
Fig. 3
Magnetization transfer MRI provides proton-density contrast in brain while saturating long-T1 extracellular protons. aR1, bR2, c magnetization transfer ratio for 2D FLASH (TR/TE = 863/4.4 ms, α = 70°), and d magnetization transfer ratio for 3D FLASH (TR/TE = 47/7.5 ms, α = 22°) as a function of the water content. Equations and correlation coefficients are: ay = − 113.29x3 + 287.52x2 + 244.5x + 70.47, r = − 0.99, by = − 66.351x + 78.25, r = − 0.65, cy = − 35.676x3 + 85.538x2 + 68.888x + 19.011, r < − 0.99, dy = − 30.301x3 + 77.288x2 + 66.429x + 19.466, r = − 0.94. e Calculated signal intensities for spoiled gradient-echo MRI as a function of water content. For a selected combination of acquisition parameters α, TR, and TE for 2D MT and 3D MT, the variables R1, R2, and MTR are obtained from the functions given above. white circle = gray matter structure, multiplication sign = WM = frontal white matter. fR1 plotted vs. the non-haemin iron content (mg iron/100 g fresh weight), g vs. the copper content (µg/g dry weight), and h vs. the manganese content (µg/g dry weight) as well as i magnetization transfer ratio (2D FLASH, TR/TE = 863/4.4 ms, α = 70°) plotted vs. the non-haemin iron content, j copper content, and k manganese content
Fig. 4
Fig. 4
Locus coeruleus can be delineated by increasing the number of slices in a similar way as by specific off-resonance pulses. (Left column) Transversal 2D fast spin-echo MRI (TR/TE = 597/7.3 ms, flip angle = 150°) with the number of slices = 3 or (right column) 21 at two different levels of the locus coeruleus (white arrows) showing magnetization transfer effect induced by repetitive refocusing pulses. Also note that the signals of the subcortical white matter (black arrows) are predominantly suppressed by magnetization transfer effect in a 21-slice acquisition and, thus, its contrast to the cortex has disappeared or is even reversed
Fig. 5
Fig. 5
MRI delineates noradrenergic neuron groups in mouse brain in vivo. a (Left column) Coronal MRI (2.35 T, RF-spoiled 3D FLASH, TR/TE = 30/7.6 ms, α 22°, Δf = 2500 Hz, ωSAT = 523°/12 ms, 117 µm isotropic resolution) of the locus coeruleus of (top row) a 4-week-old female wild-type mouse and (bottom row) an Ear2(−/−) mouse in comparison with (right column) corresponding Nissl-stained sections (adapted from Warnecke et al. 2005). b (Top) coronal MRI sections of the A2 cell groups of a 4-week-old female wild-type mouse and (bottom) an Ear2(−/−) mouse. c (Left) Coronal MRI of the locus coeruleus of three different 4-week-old female wild-type mice and (right) Ear2(−/−) mice. The bright nuclei are only seen in wild-type mice and absent in mice with locus coeruleus neuron loss. A2 A2 cell group, LC locus coeruleus
Fig. 6
Fig. 6
Dopamine β-hydroxylase has no effect on the MRI signal of the noradrenergic neurons. a Coronal MRI (for parameters, see Fig. 5) of the (upper row) locus coeruleus and (lower row) A2 cell groups of five 5-month-old control [DBH (+/−)] as well as of b five 5-month-old DBH (−/−) mice that lack dopamine β-hydroxylase
Fig. 7
Fig. 7
High signal intensity of the locus coeruleus is preserved during alterations in blood circulation. a High-resolution MRI of noradrenergic neurons in vivo at 9.4 T. (Left column) Coronal sections (80 µm isotropic resolution) in comparison with (right column) light microscopy of cell bodies (Nissl staining, contrast inverted, adapted from Mikula et al. 2007). LC = locus coeruleus, A2 = noradrenergic cell group 2 or dorsal motor nucleus of vagus, black arrowheads = white matter. b Coronal MRI (117 µm isotropic resolution) of 3-week-old male (top) animal no. 1 and (bottom) animal no. 2 under (from left to right) ketamine anesthesia, hyperoxia, 2% isoflurane, and hypoxic hypercapnia. Neither of these conditions that induce alterations in deoxyhemoglobin or blood flow substantially influences the signal intensity of the locus coeruleus (white arrows). c (Left) Horizontal MRI of animal no. 2 without and (right) with hypoxic hypercapnia. Note the preserved high signal intensity of the locus coeruleus (white arrows) despite the pronounced signal loss caused by increased deoxyhemoglobin content in dilated vasculature throughout the brain
Fig. 8
Fig. 8
Magnetization transfer MRI detects a neuron loss in the locus coeruleus in a transgenic model of Alzheimer’s disease. a (Left) Coronal MRI (for parameters see Fig. 5) of the locus coeruleus of four different (top) APP/PS1 mice (19.8 ± 1.5 months) and (bottom) APP/PS1/Ear2(−/−) mice (20.0 ± 1.2 months) in comparison with (right) corresponding tyrosine hydroxylase in situ hybridization (adapted from Kummer et al. , courtesy of Dr. Markus Kummer, contrast inverted). b Proton MRS (1.8 × 1.8 × 1.2 mm3 of the hippocampal formation) of (left) APP/PS1 (n = 8, 18.8 ± 5.8 months) and (right) APP/PS1/Ear2(−/−) (n = 10, 18.8 ± 3.6 months) mice in vivo (see Table 2). Glu glutamate, NAA N-acetylaspartate, significant decrease

Similar articles

Cited by

References

    1. Barden H, Levine S. Histochemical observations on rodent brain melanin. Brain Res Bull. 1983;10:847–851. doi: 10.1016/0361-9230(83)90218-6. - DOI - PubMed
    1. Berridge CW, Waterhouse BD. The locus coeruleus–noradrenergic system: modulation of behavioral state and state-dependent cognitive processes. Brain Res Rev. 2003;42:33–84. doi: 10.1016/S0165-0173(03)00143-7. - DOI - PubMed
    1. Blumberg WE, Goldstein M, Lauber E, Peisach J. Magnetic resonance studies on the mechanism of the enzymic β-hydroxylation of 3, 4-dihydroxyphenylethylamine. Biochim Biophys Acta. 1965;99:187–190. doi: 10.1016/S0926-6593(65)80025-X. - DOI - PubMed
    1. Burton DR, Forsen S, Karlstrom G, Dwek RA. Proton relaxation enhancement (PRE) in biochemistry: a critical survey. Prog Nucl Magn Reson Spectrosc. 1979;13:1–45. doi: 10.1016/0079-6565(79)80012-6. - DOI
    1. Clewett DV, Lee TH, Greening S, Ponzio A, Margalit E, Mather M. Neuromelanin marks the spot: identifying a locus coeruleus biomarker of cognitive reserve in healthy aging. Neurobiol Aging. 2016;37:117–126. doi: 10.1016/j.neurobiolaging.2015.09.019. - DOI - PMC - PubMed

MeSH terms