. 2019 May;130(5):727-738.
doi: 10.1016/j.clinph.2019.02.011. Epub 2019 Mar 11.

Electrophysiological differences between upper and lower limb movements in the human subthalamic nucleus

Affiliations

Electrophysiological differences between upper and lower limb movements in the human subthalamic nucleus

Gerd Tinkhauser et al. Clin Neurophysiol. 2019 May.

Abstract

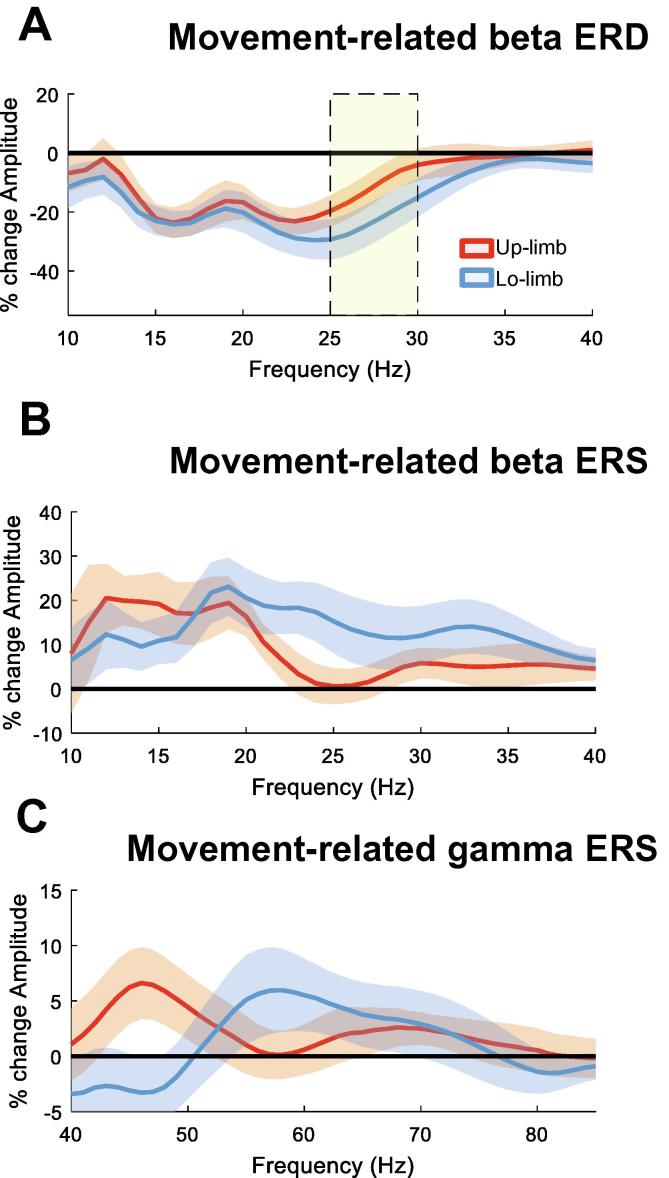
Objective: Functional processes in the brain are segregated in both the spatial and spectral domain. Motivated by findings reported at the cortical level in healthy participants we test the hypothesis in the basal ganglia of Parkinson's disease patients that lower frequency beta band activity relates to motor circuits associated with the upper limb and higher beta frequencies with lower limb movements.

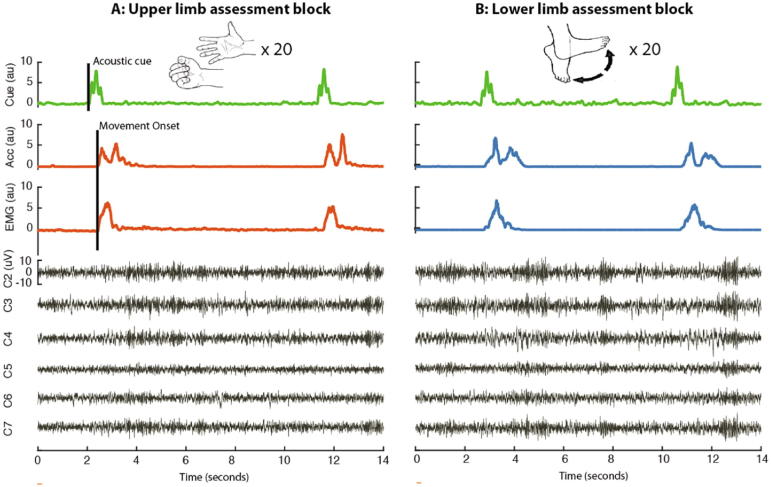
Methods: We recorded local field potentials (LFPs) from the subthalamic nucleus using segmented "directional" DBS leads, during which patients performed repetitive upper and lower limb movements. Movement-related spectral changes in the beta and gamma frequency-ranges and their spatial distributions were compared between limbs.

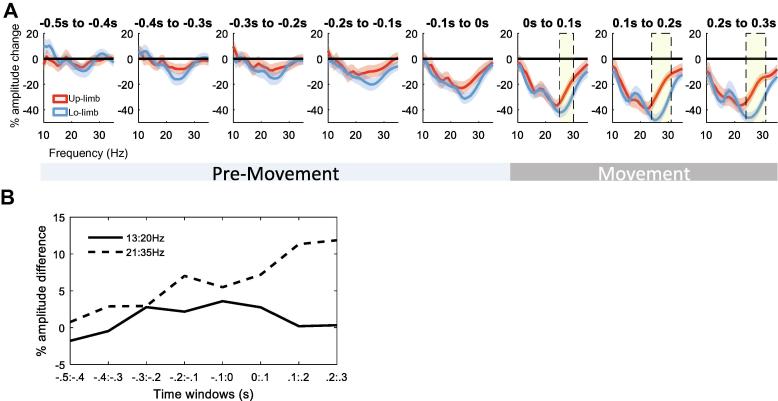
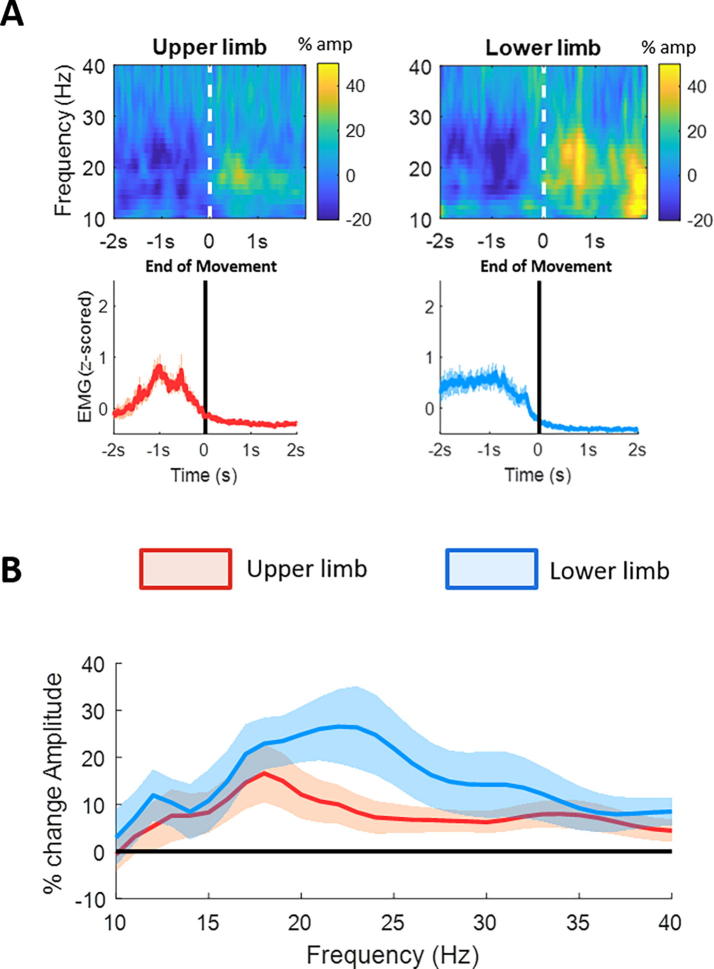
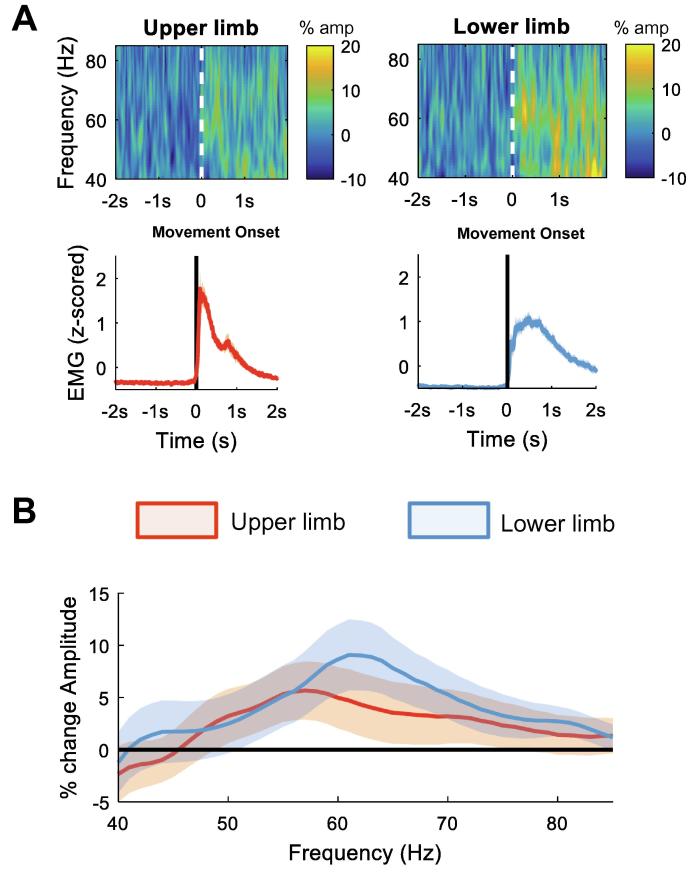
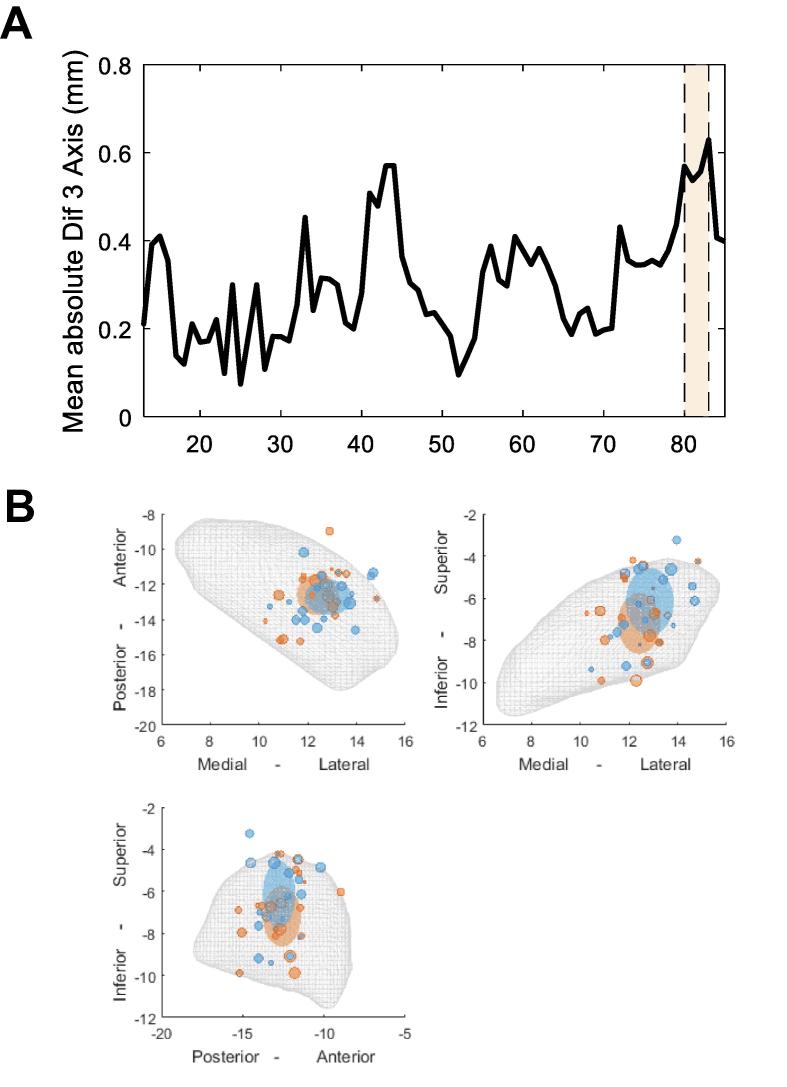
Results: We found that the beta desynchronization during leg movements is characterised by a strikingly greater involvement of higher beta frequencies (24-31 Hz), regardless of whether this was contralateral or ipsilateral to the limb moved. The spatial distribution of limb-specific movement-related changes was evident at higher gamma frequencies.

Conclusion: Limb processing in the basal ganglia is differentially organised in the spectral and spatial domain and can be captured by directional DBS leads.

Significance: These findings may help to refine the use of the subthalamic LFPs as a control signal for adaptive DBS and neuroprosthetic devices.

Keywords: Basal ganglia; Directional deep brain stimulation; Local field potentials; Motor network; Somatotopy.


Figures

Fig. 1
Fig. 1
Intraoperative assessment. Assessment of repetitive, cued upper (A) and lower (B) limb movements during simultaneous LFP recording. Surface EMG electrodes were placed on the upper limb (forearm flexor muscles) and lower limb (tibialis anterior). Accelerometers were additionally placed on the hand and foot to better delineate task-related movements. Patients were then asked to perform a block each of contralateral upper and lower limb movements followed by blocks of ipsilateral upper and lower limb movements. The upper limb movement consisted of closing and opening of the hand, while the lower limb movement involved foot dorsi-extension and then plantar flexion. Each movement was preceded by a verbal go cue and the mean inter-trial interval was 7.9 s ± 0.15. On average 16.1 ± 0.37 movements were collected within each block. LFPs were recorded simultaneously from the six directional contacts.
Fig. 2
Fig. 2
Beta ERD related to contralateral upper and lower limb movements. (A) upper panel shows the averaged time frequency spectra of the single common directional contact with greatest modulation (ERD) in the beta frequency band (13:35 Hz). All single trials were aligned to the movement onset (vertical line). The lower panel shows the corresponding normalised and averaged EMG for upper limb (forearm flexor muscles) and lower limb (tibialis anterior) movements. (B) shows the percentage movement-related spectral amplitude change in the beta frequency band for upper (red) and lower limb (blue). This was calculated as percentage change between the movement period (i.e. movement onset to 0.3 s after movement onset) and the baseline period (−2 s to −1.5 s) before movement onset. Lower limb movements involve a significantly stronger ERD in the higher beta band, in particular in the frequency range between 24 and 31 Hz (yellow shaded area). Values are mean ± SEM. (For interpretation of the references to color in this figure legend, the reader is referred to the web version of this article.)
Fig. 3
Fig. 3
Evolution of beta ERD for upper and lower limb movements: (A) shows the evolution of the beta modulation in time windows of 100 ms beginning from 500 ms before movement onset to 300 ms after movement onset. The beginning of the beta ERD difference can already be seen in the windows before movement onset. The beta ERD around 0.2 s before movement onset shows a trend for stronger deflection in the higher beta band for the lower as opposed to the upper limb movement. However, according to cluster-based permutation test the difference becomes significant only with onset of the movement (yellow shaded areas). Values are illustrated as mean ± SEM. (B) shows the evolution of the averaged amplitude differences between the upper and lower limbs in the lower (black solid line) and higher beta frequency range (black dotted line). It illustrates the growing distinction in the higher beta band, already evident in the pre-movement period, whereas the amplitude difference in the lower beta band between the limbs is marginal and fluctuates around zero.
Fig. 4
Fig. 4
Beta ERS related to contralateral upper and lower limb movements. (A) Upper panel shows the averaged time frequency spectra of the single common directional contact with greatest modulation (ERD) in the beta frequency band (13:35 Hz). All single trials were aligned to the end of the movement (vertical line). Lower panel shows the corresponding normalised and averaged EMG for upper limb (forearm flexor muscles) and lower limb (tibialis anterior) movements. (B) shows the percentage movement-related spectral amplitude change in the beta frequency band for upper (red) and lower limb (blue). This was calculated as percentage change between the movement period (i.e. end of movement to 1 s after the end of movement) and the baseline period (−2 s to −1.5 s before movement onset). There is a trend for beta ERS at higher frequencies for lower limb movements, however no significant difference on cluster-based permutation test was found. Lines depict means ± SEM. (For interpretation of the references to color in this figure legend, the reader is referred to the web version of this article.)
Fig. 5
Fig. 5
Gamma ERS related to contralateral upper and lower limb movements. (A) The upper panel shows the averaged time frequency spectra for the gamma frequency range (40:85 Hz) of the common single directional contact with greatest modulation (ERD) in the beta frequency band (13:35 Hz) (same contact as in previous figures). All single trials were aligned to the movement onset (vertical line). The lower panel shows the corresponding mean normalised EMG for upper limb (forearm flexor muscles) and lower limb (tibialis anterior) movement. (B) shows the percentage movement-related spectral amplitude change in the gamma frequency band for upper limb (red) and lower limb (blue). This was calculated as percentage change between the movement period (from 0 to 0.3 s after movement onset) and the baseline period −2 s to −1.5 s before movement onset. No significant difference in the gamma ERS was found. Lines depict means ± SEM. (For interpretation of the references to color in this figure legend, the reader is referred to the web version of this article.)
Fig. 6
Fig. 6
Beta ERD/ERS and gamma ERS related to ipsilateral upper and lower limb movements. (A) shows the movement-related beta ERD for the ipsilateral upper and lower limb. As previously shown for the contralateral limb movements, the ERD for lower limb movement is significantly greater at higher beta frequencies (24-29 Hz, yellow shaded area) than with upper limb movement. (B) shows the movement-related beta ERS for the ipsilateral upper and lower limbs. No significant difference was identified by the cluster-based permutation test, nevertheless, there was a trend for greater rebound at higher beta frequencies for the lower limb movements (similar region as shaded area in the upper panel). (C) shows the movement-related gamma ERS for the ipsilateral upper and lower limbs. No significant difference was found in the cluster-based permutation test. Lines depict means ± SEM. (For interpretation of the references to color in this figure legend, the reader is referred to the web version of this article.)
Fig. 7
Fig. 7
Spatial distribution of spectral changes related to upper and lower limb movements across electrodes. (A) illustrates the number of DBS leads (maximum n = 20) in which the maximal modulation at each frequency (13–85 Hz) occurred at the same contact for upper and lower limb movements. Contacts were more likely identical for beta frequencies (13–35 Hz: 6.7 ± 0.3 identical contacts) than for gamma frequencies (55–85 Hz: 3.4 ± 0.3 identical contacts), p < 0.001 (ranksum test). (B) correlations between the degree of modulation of all directional contacts during upper vs. lower limb movements. Illustrated are the Fisher’s Z-transformed and averaged Spearman’s correlation coefficients across the same frequency range as above. Similar as in (A), a relatively high correlation, i.e. less spatial discrimination within the DBS lead, was found for modulation at beta frequencies, and more spatial heterogeneity for the modulation at gamma frequencies where r-values dropped to near zero. Lines depict means ± SEM.
Fig. 8
Fig. 8
Spatial distribution of upper and lower limb movement-related modulation across axes within the STN. A/B/C show the expected value of the weighted probability density functions for upper (red) and lower limbs (blue) across the different frequencies for all the three axes. Similar as in Fig. 7, the spatial discrimination within the STN between upper and lower limb modulation is stronger for activity at higher frequencies. In particular, the contacts with the strongest lower limb movement-related gamma modulation were more lateral (A, 55–85 Hz) and superior (C, 70–85 Hz) than the contacts with the maximum upper limb-related modulation. (For interpretation of the references to color in this figure legend, the reader is referred to the web version of this article.)
Fig. 9
Fig. 9
Spatial distribution of upper and lower limb activity within the STN. (A) shows the absolute difference of the expected value of the pdf for upper and lower limbs based on the contacts with the highest modulation and averaged across the 3 axes. The significant cluster between 80 and 83 Hz shows that this activity was relatively spatially separated when comparing upper vs. lower limb movement. (B) shows the example for the localisation of the directional contacts with the strongest 80 Hz modulation for upper (red) and lower (blue) limb movements relative to the STN (grey mesh) in three different planes. The large ellipsoids illustrate the expected values from the pdfs. Their diameter corresponds to the mean distance of the contacts. The biggest shift is that the blue ellipsoid, which represents the spatial centre of lower limb modulation, is more superior and lateral compared to the ellipsoid representing sites showing the maximal modulation during upper limb movements. (For interpretation of the references to color in this figure legend, the reader is referred to the web version of this article.)

Similar articles

Cited by

References

    1. Androulidakis A.G., Doyle L.M.F., Gilbertson T.P., Brown P. Corrective movements in response to displacements in visual feedback are more effective during periods of 13–35 Hz oscillatory synchrony in the human corticospinal system. Eur J Neurosci. 2006;24:3299–3304. - PubMed
    1. Avants B.B., Epstein C.L., Grossman M., Gee J.C. Symmetric diffeomorphic image registration with cross-correlation: evaluating automated labeling of elderly and neurodegenerative brain. Med Image Anal. 2008;12:26–41. - PMC - PubMed
    1. Babiloni C., Babiloni F., Carducci F., Cincotti F., Cocozza G., Del Percio C. Human cortical electroencephalography (EEG) rhythms during the observation of simple aimless movements: a high-resolution EEG study. Neuroimage. 2002;17:559–572. - PubMed
    1. Brown P. Oscillatory nature of human basal ganglia activity: relationship to the pathophysiology of Parkinson’s disease. Mov Disord. 2003;18:357–363. - PubMed
    1. Brown P., Oliviero A., Mazzone P., Insola A., Tonali P., Di Lazzaro V. Dopamine dependency of oscillations between subthalamic nucleus and pallidum in Parkinson’s disease. J Neurosci. 2001;21:1033–1038. - PMC - PubMed

Publication types