. 2019 Mar 29:13:416-431.
doi: 10.1016/j.isci.2019.03.004. Epub 2019 Mar 7.

Simultaneous Photoradiochemical Labeling of Antibodies for Immuno-Positron Emission Tomography

Affiliations

Simultaneous Photoradiochemical Labeling of Antibodies for Immuno-Positron Emission Tomography

Malay Patra et al. iScience. .

Abstract

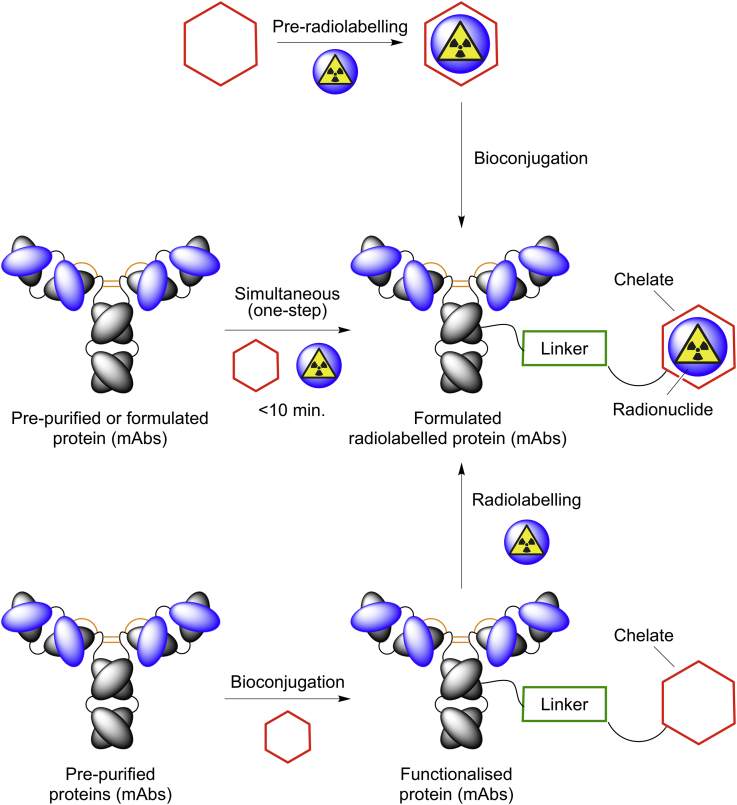
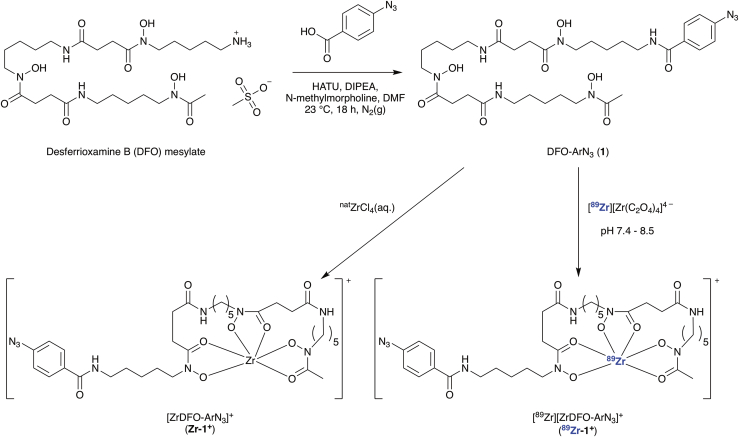
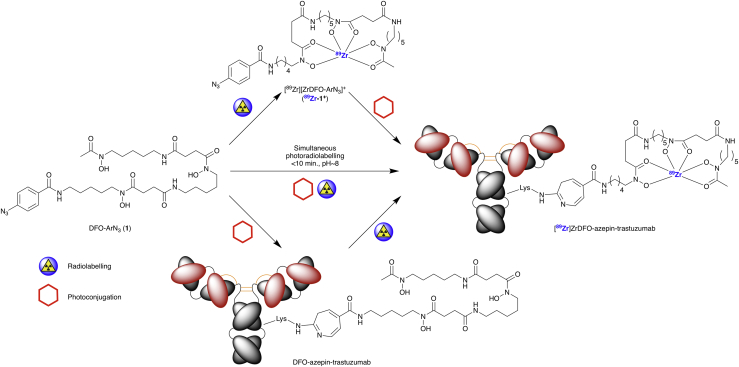
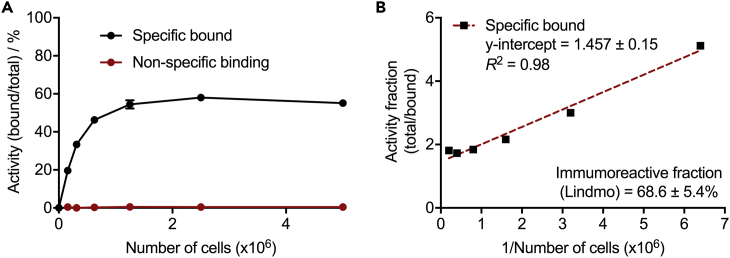
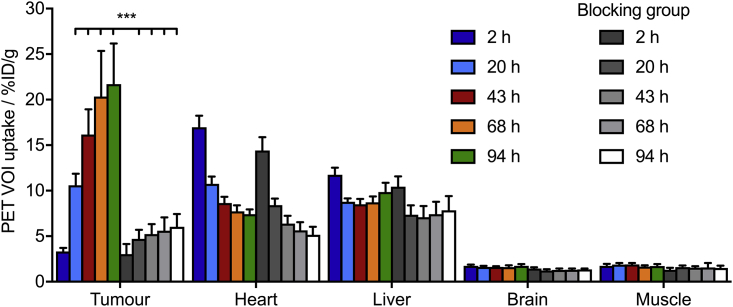
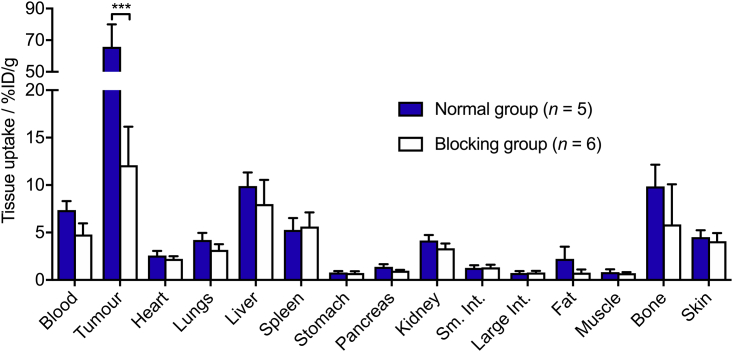
A method for the simultaneous (one-step) photochemical conjugation and 89Zr-radiolabeling of antibodies is introduced. A photoactivatable chelate based on the functionalization of desferrioxamine B with an arylazide moiety (DFO-ArN3, [1]) was synthesized. The radiolabeled complex, 89Zr-1+, was produced and characterized. Density functional theory calculations were used to investigate the mechanism of arylazide photoactivation. 89Zr-radiolabeling experiments were also used to determine the efficiency of photochemical conjugation. A standard two-step approach gave a measured conjugation efficiency of 3.5% ± 0.4%. In contrast, the one-step process gave a higher photoradiolabeling efficiency of ∼76%. Stability measurements, cellular saturation binding assays, positron emission tomographic imaging, and biodistribution studies in mice bearing SK-OV-3 tumors confirmed the biochemical viability and tumor specificity of photoradiolabeled [89Zr]ZrDFO-azepin-trastuzumab. Experimental data support the conclusion that the combination of photochemistry and radiochemistry is a viable strategy for producing radiolabeled proteins for imaging and therapy.

Keywords: Density Functional Theory (DFT); Medical Imaging; Radiochemicals.


Figures

None
Graphical abstract
Scheme 1
Scheme 1
Mechanistic Routes toward Radiolabeled Antibodies and Other Proteins
Scheme 2
Scheme 2
Chemical Synthesis of DFO-ArN3 (1) and Complexation of Zr4+ Ions to Give the Non-radioactive (Zr-1+) and Radiolabeled 89Zr-1+) Coordination Complexes
Figure 1
Figure 1
Radioactive UHPLC Characterization Data UHPLC chromatograms showing quantitative radiolabeling to give [89Zr][ZrDFO-ArN3]+ (89Zr-1+, blue trace, RCP >99%, RCC >99%) and electronic absorption chromatograms measured at 220 nm (green), 254 nm (red), and 280 nm (black) showing co-elution with an authenticated sample of non-radioactive Zr-1+.
Figure 2
Figure 2
Kinetic Data on the Photochemically Induced Degradation of Compound 1 during Irradiation with UV Light (365 nm) (A) Normalized UHPLC chromatograms recorded between 0 and 25 min (50% LED power). * Indicates starting material (compound 1). (B) Kinetic plot showing the change in concentration of compound 1 versus irradiation time (min.) using different LED intensities. Note, data are fitted with a first-order decay (R2 >0.999 for each dataset), and the observed first-order rate constants, kobs/min−1, are shown in the inset. Error bars correspond to one standard deviation. (C) Plot of the normalized observed rate constant versus the normalized LED intensity confirming that photodegradation is first order (gradient ∼1.0) with respect to light intensity.
Figure 3
Figure 3
DFT-Calculated (uB3LYP/6-311++G(d,p)/PCM) Reaction Coordinate The relative calculated differences in free energy (ΔG/kJ mol−1), enthalpy (ΔH/kJ mol−1), and entropy (ΔS/J K−1 mol−1, at 298.15 K) of the various intermediates and transition states that connect arylazide (PhN3) with the N-methyl-cis-azepin-2-amine product are shown. Photochemically induced reactivity of arylazides proceeds via the ground-state open-shell singlet nitrene (1A2 state) corresponding to the (px)1(py)1 electronic configuration where the py orbital on the N atom lies in the plane of the C6H5 ring. Note, owing to spin contamination, the energy of the 1A2 state was estimated using the sum method by Ziegler et al. (Ziegler and Rank, 1977).
Figure 4
Figure 4
Experimental Electronic Absorption Spectroscopy and Time-Dependent DFT Overlay of the experimentally measured electronic absorption spectrum of compound 1 and the TD-DFT (uB3LYP/6-311++G(d,p)/PCM)-calculated spectrum of the model compound arylazide (PhN3). Note that the calculated spectrum was produced by using Lorentzian broadening, 20-nm full-width at half maximum. Calculated energies and oscillator strengths (f/a.u.) of the bands corresponding to transitions to the first six excited singlet states with non-zero expectation values are shown by vertical red lines (band details inset). For reference, band energies to the excited triplet states are shown by vertical green lines. The simulated spectrum and all calculated energies are x-shifted by +12 nm for clarity. Molecular orbital contributions involved in the excitation to the main singlet bands are presented in Table S1.
Figure 5
Figure 5
Molecular Orbital Diagram of ArN3 DFT-calculated (B3LYP/6-311++G(d,p)/PCM) molecular orbital diagram. Electron density isosurfaces of the three highest occupied molecular orbitals (HOMOs) and three lowest unoccupied molecular orbitals (LUMOs) for the model compound arylazide (PhN3) are shown. Note that the isosurfaces were generated by using a contour value of 0.035 and correspond to 96.5% of the total electron density.
Scheme 3
Scheme 3
Photoradiochemical Synthesis of [89Zr]ZrDFO-Azepin-Trastuzumab via Three Separate Routes (Top) Pre-radiolabelling and subsequent photochemical conjugation of [89Zr]ZrDFO-ArN3 (89Zr-1+) with the antibody. (Middle) Simultaneous one-step photoradiochemical labeling. (Bottom) Two-step photochemical conjugation of the antibody and subsequent 89Zr radiolabeling of the isolated DFO-azepin-trastuzumab intermediate.
Figure 6
Figure 6
Characterization Data for the Radiochemical Synthesis of [89Zr]ZrDFO-Azepin-Trastuzumab (A) Radio-iTLC chromatograms showing [89Zr]ZrEDTA control; the crude reaction mixture at 15, 40, and 60 min; and the purified product. (B and C) (B) Analytical PD-10-SEC elution profiles, and (C) SEC-UHPLC chromatograms of the crude and purified product.
Figure 7
Figure 7
[89Zr]ZrDFO-azepin-trastuzumab Radiolabeling Kinetics and Stability Data (A) Radio-iTLC chromatograms showing the kinetics of formation of [89Zr]ZrDFO-azepin-trastuzumab versus time using a pre-functionalized DFO-azepin-trastuzumab sample prepared with an initial chelate-to-mAb ratio of 26.4:1. Data for reactions starting with different initial chelate-to-mAb ratios are presented in Figure S11. (B) Plot of the percentage radiochemical conversion (RCC) versus time using samples of DFO-azepin-trastuzumab pre-conjugated at different initial chelate-to-mAb ratios. (C) Radioactive SEC-UHPLC confirming that [89Zr]ZrDFO-azepin-trastuzumab remains stable with respect to change in radiochemical purity during incubation in human serum at 37°C for 92 h.
Figure 8
Figure 8
Measurement of the Immunoreactive Fraction of [89Zr]ZrDFO-Azepin-Trastuzumab as Determined by Cellular Binding to SK-OV-3 (HER2/neu positive) Cells (A) Saturation binding plot. Error bars correspond to one standard deviation. (B) Lindmo plot.
Figure 9
Figure 9
Temporal [89Zr]ZrDFO-Azepin-Trastuzumab PET Images Recorded in Mice Bearing SK-OV-3 Tumors on the Right Flank T, tumor; H, heart; L, liver; Sp, spleen
Figure 10
Figure 10
Time-Activity Bar Chart Showing the Activity Associated with Different Tissues (volumes of Interest, VOI) versus Time Data presented are based on quantification of the PET images in units of %ID cm−3. Equivalent data using quantification of the PET images in terms of the mean standardized uptake value are shown in Figure S14. Error bars correspond to one standard deviation.
Figure 11
Figure 11
Bar Chart Showing Ex Vivo Biodistribution Data (%ID/g) for the Uptake of [89Zr]ZrDFO-Azepin-Trastuzumab in Mice Bearing Subcutaneous SK-OV-3 Tumors Data were recorded after the final imaging time point at 94 h post-injection. ***Student's t test p value < 0.001. An equivalent plot using units of standardized uptake value is presented in Figure S17. Data showing tumor-to-tissue contrast ratios are presented in Figure S18. Error bars correspond to one standard deviation.
Figure 12
Figure 12
Characterization Data for the Simultaneous One-Pot Photoradiochemical Synthesis of [89Zr]ZrDFO-Azepin-Trastuzumab (A and B) (A) Radio-iTLC chromatograms showing control reactions in the absence of compound 1 (no chelate, green) or mAb (yellow), 89Zr-1+ before irradiation (purple), and the crude products after irradiation with 365 nm (black) and 395 nm (red). (B) Analytical PD-10-SEC elution profiles showing the [89Zr][ZrDTPA] control (green, equivalent to the no chelate control confirming no non-specific binding of 89Zr4+ ions to the mAb), a control reaction without mAb (yellow), crude reaction mixtures after irradiation and DTPA quenching at 365 nm (black) and 395 nm (red), and the purified product (blue). (C) SEC-UHPLC chromatograms of the crude and purified product.

Similar articles

Cited by

References

    1. Bayley H., Knowles J.R. Photoaffinity labeling. Methods Enzymol. 1977;46:69–114. - PubMed
    1. Borden W.T., Gritsan N.P., Hadad C.M., Karney W.L., Kemnitz C.R., Platz M.S. The interplay of theory and experiment in the study of phenylnitrene. Acc. Chem. Res. 2000;33:765–771. - PubMed
    1. Boros E., Holland J.P. Chemical aspects of metal ion chelation in the synthesis and application antibody-based radiotracers. J. Label. Compd. Radiopharm. 2018;61:652–671. - PMC - PubMed
    1. Bou-Hamdan F.R., Lévesque F., O’Brien A.G., Seeberger P.H. Continuous flow photolysis of aryl azides: preparation of 3H-azepinones. Beilstein J. Org. Chem. 2011;7:1124–1129. - PMC - PubMed
    1. Chowdhry V., Westheimer F.H. Photoaffinity labeling of biological systems. Annu. Rev. Biochem. 1979;48:293–325. - PubMed

LinkOut - more resources