

Metformin-induced changes of the gut microbiota in healthy young men: results of a non-blinded, one-armed intervention study
- PMID: 30904939
- PMCID: PMC6509092
- DOI: 10.1007/s00125-019-4848-7
Metformin-induced changes of the gut microbiota in healthy young men: results of a non-blinded, one-armed intervention study
Abstract
Aims/hypothesis: Individuals with type 2 diabetes have an altered bacterial composition of their gut microbiota compared with non-diabetic individuals. However, these alterations may be confounded by medication, notably the blood-glucose-lowering biguanide, metformin. We undertook a clinical trial in healthy and previously drug-free men with the primary aim of investigating metformin-induced compositional changes in the non-diabetic state. A secondary aim was to examine whether the pre-treatment gut microbiota was related to gastrointestinal adverse effects during metformin treatment.
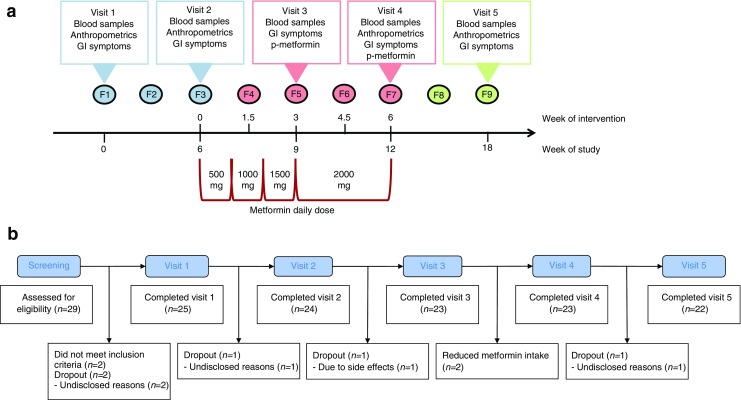
Methods: Twenty-seven healthy young Danish men were included in an 18-week one-armed crossover trial consisting of a pre-intervention period, an intervention period and a post-intervention period, each period lasting 6 weeks. Inclusion criteria were men of age 18-35 years, BMI between 18.5 kg/m2 and 27.5 kg/m2, HbA1c < 39 mmol/mol (5.7%) and plasma creatinine within the normal range. No prescribed medication, including antibiotics, for 2 months prior to recruitment were allowed and no previous gastrointestinal surgery, discounting appendectomy or chronic illness requiring medical treatment. During the intervention the participants were given metformin up to 1 g twice daily. Participants were examined five times in the fasting state with blood sampling and recording of gastrointestinal symptoms. Examinations took place at Frederiksberg Hospital, Denmark before and after the pre-intervention period, halfway through and immediately after the end of intervention and after the wash-out period. Faecal samples were collected at nine evenly distributed time points, and bacterial DNA was extracted and subjected to 16S rRNA gene amplicon sequencing in order to evaluate gut microbiota composition. Subjective gastrointestinal symptoms were reported at each visit.
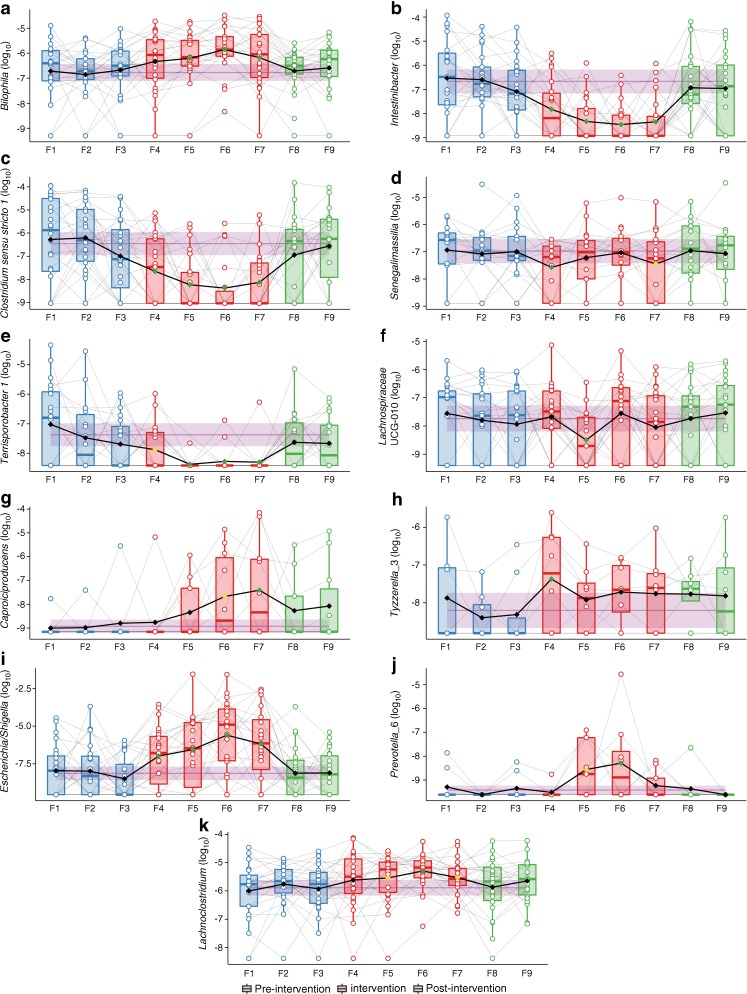
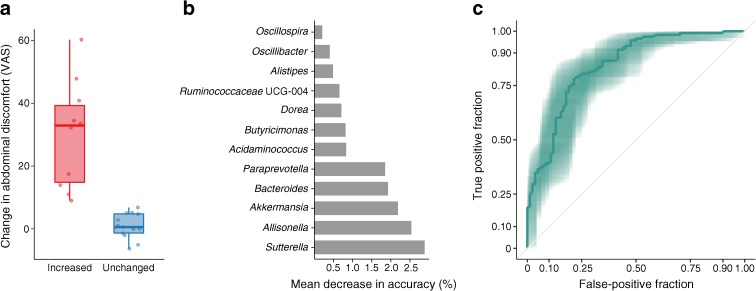
Results: Data from participants who completed visit 1 (n=23) are included in analyses. For the primary outcome the relative abundance of 11 bacterial genera significantly changed during the intervention but returned to baseline levels after treatment cessation. In line with previous reports, we observed a reduced abundance of Intestinibacter spp. and Clostridium spp., as well as an increased abundance of Escherichia/Shigella spp. and Bilophila wadsworthia. The relative abundance at baseline of 12 bacterial genera predicted self-reported gastrointestinal adverse effects.
Conclusions/interpretation: Intake of metformin changes the gut microbiota composition in normoglycaemic young men. The microbiota changes induced by metformin extend and validate previous reports in individuals with type 2 diabetes. Secondary analyses suggest that pre-treatment gut microbiota composition may be a determinant for development of gastrointestinal adverse effects following metformin intake. These results require further investigation and replication in larger prospective studies.
Trial registration: Clinicaltrialsregister.eu 2015-000199-86 and ClinicalTrials.gov NCT02546050 FUNDING: This project was funded by Danish Diabetes Association and The Novo Nordisk Foundation.
Keywords: Drug therapy; Gut microbiota; Intervention; Metformin; Microbiome; Microbiota; Type 2 diabetes.
Conflict of interest statement
The authors declare that there is no duality of interest associated with this manuscript.
Figures
Similar articles
-
Metformin-induced changes of the gut microbiota in patients with type 2 diabetes mellitus: results from a prospective cohort study.Endocrine. 2024 Sep;85(3):1178-1192. doi: 10.1007/s12020-024-03828-x. Epub 2024 May 18. Endocrine. 2024. PMID: 38761345
-
Metformin Is Associated With Higher Relative Abundance of Mucin-Degrading Akkermansia muciniphila and Several Short-Chain Fatty Acid-Producing Microbiota in the Gut.Diabetes Care. 2017 Jan;40(1):54-62. doi: 10.2337/dc16-1324. Epub 2016 Nov 14. Diabetes Care. 2017. PMID: 27999002
-
Virtualized clinical studies to assess the natural history and impact of gut microbiome modulation in non-hospitalized patients with mild to moderate COVID-19 a randomized, open-label, prospective study with a parallel group study evaluating the physiologic effects of KB109 on gut microbiota structure and function: a structured summary of a study protocol for a randomized controlled study.Trials. 2021 Apr 2;22(1):245. doi: 10.1186/s13063-021-05157-0. Trials. 2021. PMID: 33810796 Free PMC article.
-
Metformin: old friend, new ways of action-implication of the gut microbiome?Curr Opin Clin Nutr Metab Care. 2018 Jul;21(4):294-301. doi: 10.1097/MCO.0000000000000468. Curr Opin Clin Nutr Metab Care. 2018. PMID: 29634493 Review.
-
Metformin and gut microbiota: their interactions and their impact on diabetes.Hormones (Athens). 2019 Jun;18(2):141-144. doi: 10.1007/s42000-019-00093-w. Epub 2019 Feb 4. Hormones (Athens). 2019. PMID: 30719628 Review.
Cited by
-
Metformin: Diverse molecular mechanisms, gastrointestinal effects and overcoming intolerance in type 2 Diabetes Mellitus: A review.Medicine (Baltimore). 2024 Oct 25;103(43):e40221. doi: 10.1097/MD.0000000000040221. Medicine (Baltimore). 2024. PMID: 39470509 Free PMC article. Review.
-
Diabetes Mellitus and Gastric Cancer: Correlation and Potential Mechanisms.J Diabetes Res. 2023 Nov 9;2023:4388437. doi: 10.1155/2023/4388437. eCollection 2023. J Diabetes Res. 2023. PMID: 38020199 Free PMC article. Review.
-
Myoinositol and Metformin in the Prevention of Gestational Diabetes in High-Risk Patients: A Narrative Review.J Clin Med. 2024 Sep 12;13(18):5387. doi: 10.3390/jcm13185387. J Clin Med. 2024. PMID: 39336874 Free PMC article. Review.
-
Repurposing Metformin in Nondiabetic People With HIV: Influence on Weight and Gut Microbiota.Open Forum Infect Dis. 2020 Sep 11;7(9):ofaa338. doi: 10.1093/ofid/ofaa338. eCollection 2020 Sep. Open Forum Infect Dis. 2020. PMID: 32964062 Free PMC article.
-
A Pilot Study Exploring the Association of Entacapone, Gut Microbiota, and the Subsequent Side Effects in Patients With Parkinson's Disease.Front Cell Infect Microbiol. 2022 Apr 5;12:837019. doi: 10.3389/fcimb.2022.837019. eCollection 2022. Front Cell Infect Microbiol. 2022. PMID: 35463646 Free PMC article.
References
Publication types
MeSH terms
Substances
Associated data
LinkOut - more resources
Full Text Sources
Medical
Miscellaneous
