

Expression of tSTAT3, pSTAT3727 , and pSTAT3 705 in the epithelial cells of hormone-naïve prostate cancer
- PMID: 30905090
- PMCID: PMC6766958
- DOI: 10.1002/pros.23787
Expression of tSTAT3, pSTAT3727 , and pSTAT3 705 in the epithelial cells of hormone-naïve prostate cancer
Abstract
Background: The signal transducer and activator of transcription 3 (STAT3) pathway is observed to be constitutively activated in several malignancies including prostate cancer (PCa). In the present study, we investigated the expression of total STAT3 (tSTAT3) and two forms of activated phosphorylated STAT3 (pSTAT3727 and pSTAT3705 ) in tissue microarrays (TMA) of two cohorts of localized hormone-naïve PCa patients and analyzed associations between the expression and disease outcome.
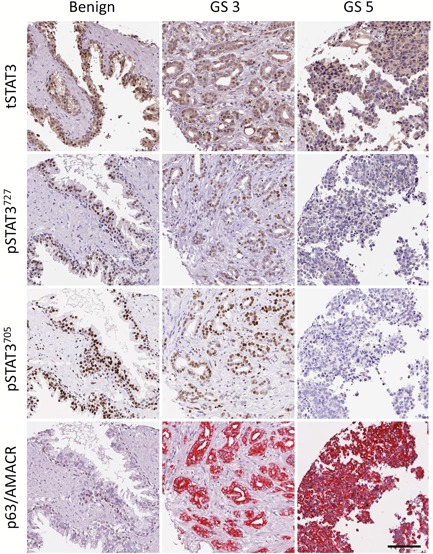
Methods: The expression of tSTAT3, pSTAT3727 , and pSTAT3705 was scored in the nuclei and cytoplasm of prostatic gland epithelial cells in two TMAs of paraffin-embedded prostatic tissue. The TMAs consisted of tissue originated from hormone-naïve radical prostatectomy patients from two different sites: Malmö, Sweden (n = 300) and Dublin, Ireland (n = 99).
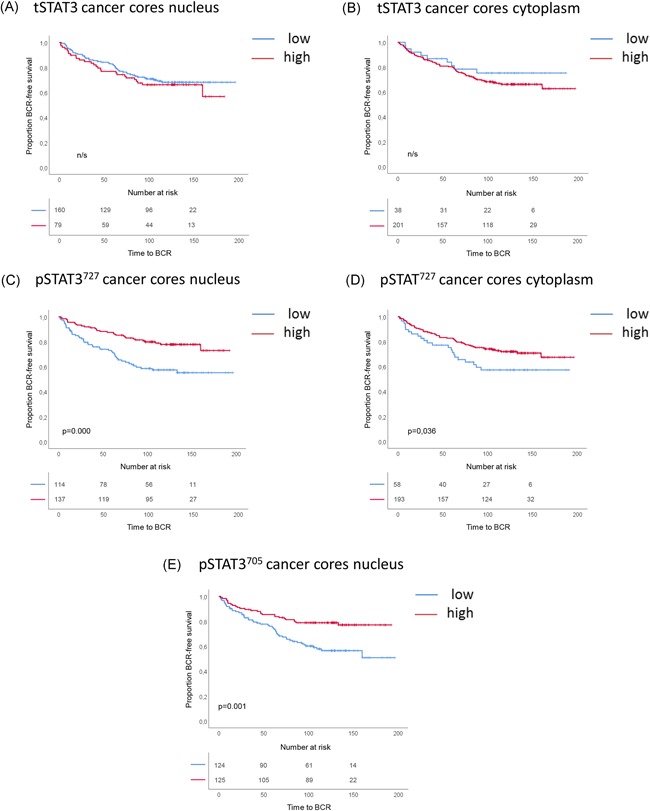
Results: The nuclear expression levels of tSTAT3, pSTAT3727 , and pSTAT3705 in the epithelial cells of benign glands were significantly higher than in the cancerous glands. Cytoplasmic tSTAT3 levels were also higher in benign glands. Patients with low pSTAT3727 and pSTAT3705 levels in the cancerous glands showed reduced times to biochemical recurrence, compared with those with higher levels. No significant trends in nuclear nor in cytoplasmic tSTAT3 were observed in relation to biochemical recurrence in the Malmö cohort. Higher cytoplasmic tSTAT3 was associated with reduced time to biochemical recurrence in the Dublin cohort. Adding the tSTAT3 and pSTAT3 expression data to Gleason score or pathological T stage did not improve their prognostic values.
Conclusions: Low pSTAT3727 and pSTAT3705 expression in epithelial cells of cancerous prostatic glands in hormone-naïve PCa was associated with faster disease progression. However, pSTAT3 and tSTAT3 expression did not improve the prognostic value of Gleason score or pathological T stage and may not be a good biomarker in the early hormone naïve stages of PCa.
Keywords: biomarker; immunohistochemistry; prostate cancer; signal transducer and activator of transcription 3; tissue microarray.
© 2019 The Authors. The Prostate Published by Wiley Periodicals, Inc.
Conflict of interest statement
AB and RH are cofounders and shareholders in Glactone Pharma AB.
Figures


Similar articles
-
Nuclear expression of pSTAT3Tyr705 and pSTAT3Ser727 in the stromal compartment of localized hormone-naïve prostate cancer.Pathol Res Pract. 2022 Apr;232:153811. doi: 10.1016/j.prp.2022.153811. Epub 2022 Feb 19. Pathol Res Pract. 2022. PMID: 35259550
-
High level of androgen receptor is associated with aggressive clinicopathologic features and decreased biochemical recurrence-free survival in prostate: cancer patients treated with radical prostatectomy.Am J Surg Pathol. 2004 Jul;28(7):928-34. doi: 10.1097/00000478-200407000-00013. Am J Surg Pathol. 2004. PMID: 15223964
-
Validation of the prognostic value of NF-κB p65 in prostate cancer: A retrospective study using a large multi-institutional cohort of the Canadian Prostate Cancer Biomarker Network.PLoS Med. 2019 Jul 2;16(7):e1002847. doi: 10.1371/journal.pmed.1002847. eCollection 2019 Jul. PLoS Med. 2019. PMID: 31265453 Free PMC article.
-
The role of phosphorylated signal transducer and activator of transcription 3 (pSTAT3) in peripheral nerve sheath tumours.Histopathology. 2017 May;70(6):946-953. doi: 10.1111/his.13154. Epub 2017 Feb 9. Histopathology. 2017. PMID: 27992966
-
A model for the design and construction of a resource for the validation of prognostic prostate cancer biomarkers: the Canary Prostate Cancer Tissue Microarray.Adv Anat Pathol. 2013 Jan;20(1):39-44. doi: 10.1097/PAP.0b013e31827b665b. Adv Anat Pathol. 2013. PMID: 23232570 Free PMC article. Review.
Cited by
-
Cellular and Molecular Mechanisms Underlying Prostate Cancer Development: Therapeutic Implications.Medicines (Basel). 2019 Jul 30;6(3):82. doi: 10.3390/medicines6030082. Medicines (Basel). 2019. PMID: 31366128 Free PMC article. Review.
-
pSTAT3 Expression is Increased in Advanced Prostate Cancer in Post-Initiation of Androgen Deprivation Therapy.Prostate. 2025 Feb;85(3):252-264. doi: 10.1002/pros.24820. Epub 2024 Nov 11. Prostate. 2025. PMID: 39523927 Free PMC article.
-
STAT3 and Its Pathways' Dysregulation-Underestimated Role in Urological Tumors.Cells. 2022 Sep 27;11(19):3024. doi: 10.3390/cells11193024. Cells. 2022. PMID: 36230984 Free PMC article. Review.
-
Immunohistochemical expression of Cyclin D1 among Sudanese patients diagnosed with benign and malignant prostatic lesions.BMC Res Notes. 2020 Jun 17;13(1):295. doi: 10.1186/s13104-020-05138-7. BMC Res Notes. 2020. PMID: 32552908 Free PMC article.
References
Publication types
MeSH terms
Substances
Grants and funding
LinkOut - more resources
Full Text Sources
Other Literature Sources
Medical
Miscellaneous
