Comparative Study
. 2019 May;73(5):998-1006.
doi: 10.1161/HYPERTENSIONAHA.118.12109.

Gut Microbiota Composition and Blood Pressure

Affiliations
Comparative Study

Gut Microbiota Composition and Blood Pressure

Shan Sun et al. Hypertension. 2019 May.

Abstract

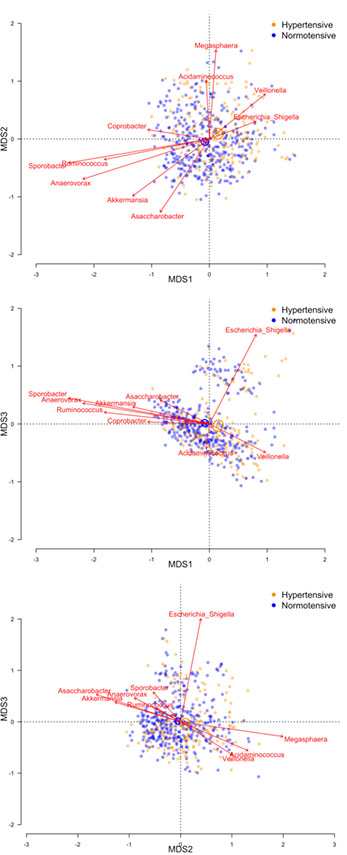
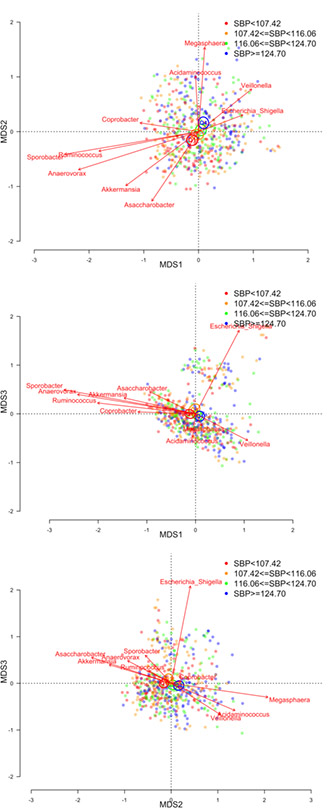
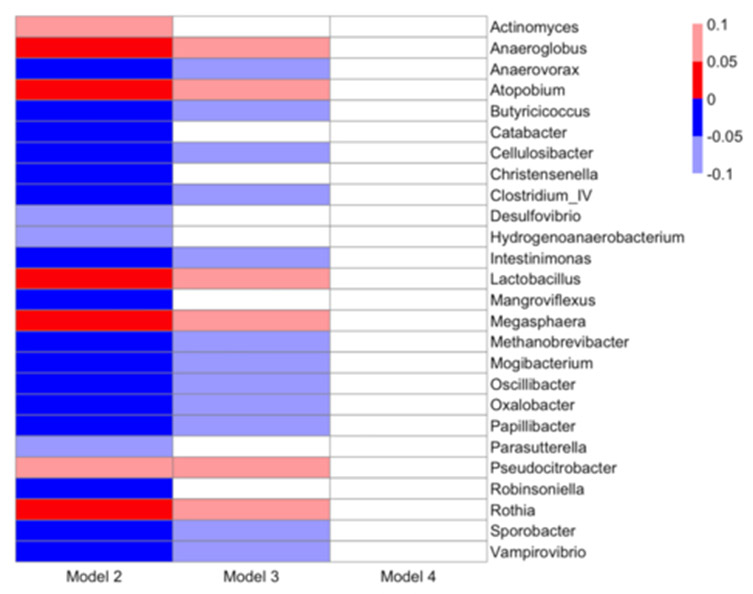
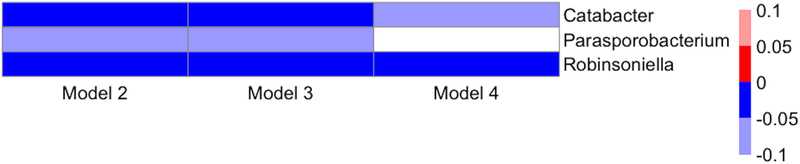
Animal models support a role for the gut microbiota in the development of hypertension. There has been a lack of epidemiological cohort studies to confirm these findings in human populations. We examined cross-sectional associations between measures of gut microbial diversity and taxonomic composition and blood pressure (BP) in 529 participants of the biracial (black and white) CARDIA study (Coronary Artery Risk Development in Young Adults). We sequenced V3-V4 regions of the 16S ribosomal RNA marker gene using DNA extracted from stool samples collected at CARDIA's Year 30 follow-up examination (2015-2016; aged 48-60 years). We quantified associations between BP (hypertension [defined as systolic BP ≥140 mm Hg or diastolic BP ≥90 mm Hg or antihypertension medication use] and systolic BP) and within and between-person diversity measures. We conducted genera-specific multivariable-adjusted regression analysis, accounting for multiple comparisons using the false discovery rate. Hypertension and systolic BP were inversely associated with measures of α-diversity, including richness and the Shannon Diversity Index, and were distinguished with respect to principal coordinates based on a similarity matrix of genera abundance. Several specific genera were significantly associated with hypertension and systolic BP, though results were attenuated with adjustment for body mass index. Our findings support associations between within-person and between-person gut microbial community diversity and taxonomic composition and BP in a diverse population-based cohort of middle-aged adults. Future study is needed to define functional pathways that underlie observed associations and identify specific microbial targets for intervention.

Keywords: blood pressure; epidemiology; gastrointestinal microbiome; hypertension; population.


Conflict of interest statement

Conflicts of Interest/Disclosures

None

Figures

Figure 1.
Figure 1.
Microbial similarity biplots (joint PCoA axes) for study participants with hypertension (orange) or normal blood pressure (blue). Biplots shown for PCoA axes that explain at least 5% of variability in microbial similarity. Centroids illustrate the 95% confidence interval for the mean location of each population group. The ten most abundant genera are shown with respect to their directional association along PCoA axes, with vector length indicating the strength of association. PERMANOVA p-values were 0.001 for hypertension in each of the five multivariable-adjusted models. Model 1 adjusted for sequencing run; Model 2 additionally adjusted for age, race, gender, study center, and educational attainment; Model 3 additionally adjusted for smoking, physical activity, and diet quality score; Model 4 additionally adjusted for BMI; Model 5: adjusted for Model 3 covariates, with the addition of waist circumference.
Figure 2.
Figure 2.
Microbial similarity biplots (joint PCoA axes) for study participants with respect to quartiles (Q1-Q4) of systolic blood pressure (Q1: red; Q2: brown; Q3: green; Q4: blue). Biplots shown for PCoA axes that explain at least 5% of variability in microbial similarity. Centroids illustrate the 95% confidence interval for the mean location of each population group. The ten most abundant genera are shown with respect to their directional association along PCoA axes, with vector length indicating the strength of association. PERMANOVA p-values were 0.001 for systolic blood pressure in each of the five multivariable-adjusted models. Model 1 adjusted for sequencing run; Model 2 additionally adjusted for age, race, gender, study center, and educational attainment; Model 3 additionally adjusted for smoking, physical activity, diet quality score, and antihypertensive medication; Model 4 additionally adjusted for BMI; Model 5: adjusted for Model 3 covariates, with the addition of waist circumference.
Figure 3.
Figure 3.
Heatmap of associations between genera and hypertension from multivariable-adjusted models. Direction of association is indicated by color (blue: negative, red: positive) and FDR-adjusted p-values (q-values) are indicated by shading (bold: q-value<0.05, light: 0.05≤q-value<1.0). Multivariable-adjusted regression models adjusted for: Model 2: sequencing run, age, race, gender, study center, educational attainment; Model 3: additionally adjusted for smoking, physical activity, and diet quality score; Model 4: additionally adjusted for BMI. Results are not shown for Model 5, which adjusted for Model 3 covariates plus waist circumference, as Model 5 results were not meaningfully different from Model 4 results.
Figure 4.
Figure 4.
Heatmap of associations between genera and systolic blood pressure from multivariable-adjusted models. Direction of association is indicated by color (blue: negative, red: positive) and FDR-adjusted p-values (q-values) are indicated by shading (bold: q-value<0.05, light: 0.05≤q-value<1.0). Multivariable-adjusted regression models adjusted for: Model 2: sequencing run, age, race, gender, study center, educational attainment; Model 3: additionally adjusted for smoking, physical activity, diet quality score, and antihypertensive medication use; Model 4: additionally adjusted for BMI. Results are not shown for Model 5, which adjusted for Model 3 covariates plus waist circumference, as Model 5 results were not meaningfully different from Model 4 results.

Comment in

  • Pressure From the Bugs Within.
    Jordan J, Moeller R, Chakraborty S, Vijay-Kumar M, Joe B. Jordan J, et al. Hypertension. 2019 May;73(5):977-979. doi: 10.1161/HYPERTENSIONAHA.119.12685. Hypertension. 2019. PMID: 30905193 Free PMC article. No abstract available.

References

    1. Tang WH, Wang Z, Levison BS, Koeth RA, Britt EB, Fu X, Wu Y, Hazen SL. Intestinal microbial metabolism of phosphatidylcholine and cardiovascular risk. N Engl J Med. 2013;368:1575–84. - PMC - PubMed
    1. Wang Z, Klipfell E, Bennett BJ, et al. Gut flora metabolism of phosphatidylcholine promotes cardiovascular disease. Nature. 2011;472:57–63. - PMC - PubMed
    1. Fu J, Bonder MJ, Cenit MC, et al. The Gut Microbiome Contributes to a Substantial Proportion of the Variation in Blood Lipids. Circ Res. 2015;117:817–24. - PMC - PubMed
    1. Kelly TN, Bazzano LA, Ajami NJ, He H, Zhao J, Petrosino JF, Correa A, He J. Gut Microbiome Associates With Lifetime Cardiovascular Disease Risk Profile Among Bogalusa Heart Study Participants. Circ Res. 2016;119:956–64. - PMC - PubMed
    1. Org E, Blum Y, Kasela S, Mehrabian M, Kuusisto J, Kangas AJ, Soininen P, Wang Z, Ala-Korpela M, Hazen SL, Laakso M, Lusis AJ. Relationships between gut microbiota, plasma metabolites, and metabolic syndrome traits in the METSIM cohort. Genome Biol. 2017;18:70. - PMC - PubMed

Publication types

Substances