. 2019 May 8;102(3):636-652.e7.
doi: 10.1016/j.neuron.2019.02.035. Epub 2019 Mar 21.

Distinct Cortical-Thalamic-Striatal Circuits through the Parafascicular Nucleus

Affiliations

Distinct Cortical-Thalamic-Striatal Circuits through the Parafascicular Nucleus

Gil Mandelbaum et al. Neuron. .

Abstract

The thalamic parafascicular nucleus (PF), an excitatory input to the basal ganglia, is targeted with deep-brain stimulation to alleviate a range of neuropsychiatric symptoms. Furthermore, PF lesions disrupt the execution of correct motor actions in uncertain environments. Nevertheless, the circuitry of the PF and its contribution to action selection are poorly understood. We find that, in mice, PF has the highest density of striatum-projecting neurons among all sub-cortical structures. This projection arises from transcriptionally and physiologically distinct classes of PF neurons that are also reciprocally connected with functionally distinct cortical regions, differentially innervate striatal neurons, and are not synaptically connected in PF. Thus, mouse PF contains heterogeneous neurons that are organized into parallel and independent associative, limbic, and somatosensory circuits. Furthermore, these subcircuits share motifs of cortical-PF-cortical and cortical-PF-striatum organization that allow each PF subregion, via its precise connectivity with cortex, to coordinate diverse inputs to striatum.

Keywords: STPT; action selection; basal ganglia; corticothalamic loops; electrophysiology; parafascicular nucleus; single-cell transcriptional analysis; thalamus.


Figures

Fig. 1:
Fig. 1:. Serial two photon tomography defines PF as the main sub-cortical input to STR.
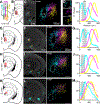
A, left, Schematic of the experimental design showing a coronal section at +0.9 mm from a mouse with 4 injections of RV-nGFP in STR (region of injection is highlighted in orange in all figures). middle, Schematic of STPT, which automatically slices and images the whole brain using a microtome (MT) built into a 2-photon laser-scanning microscope. right, Image of a brain slice obtained approximately 1 week after virus injection that was aligned to the ABA and 3D reconstructed. B, STPT image of the nucleus of a cell infected with RV-nGFP (white) with the border of nGFP marked (green line). C, Number of cells detected in PF by manual (MC) and automated (AC) counting (n=3 mice). P=0.5; Wilcoxon test. Red error bars in this and subsequent panels indicate ±SEM and black bar indicates the mean. In this panel and D, F and G each black circle indicates data from one mouse. D, Percentage of RV-nGFP+ cells in each indicated sub-CTX region for the experiment shown in (A) (n=60857/7 cells/mice). E, Coronal sections of TH at −1.4 (left) and −2.1 (right) mm showing RV-nGFP+ cells (white). On the left, boundaries of TH nuclei are shown with thin dashed lines CONTRA to the injection site in STR to not obscure the nGFP signal. The midline is indicated. F, Percentage of TH RV-nGFP+ cells found in sensory-motor (DORsm) or poly-modal association (DORpm) cortex related regions of TH (n=26490/7 cells/mice). G, Percentage of DORpm RV-nGFP+ cells found in 4 DORpm nuclei groups (n=23191/7 cells/mice). H, Pie chart of distribution of RV-nGFP+ cells across ILM TH nuclei (n=10019/7 cells/mice). I, Relative cell density (defined by % of total RV-nGFP+ cells in each brain region divided by the its volume) for 706 regions. Each circle shows the mean density across mice (n=7). Regions with high densities of RV-nGFP+ cells are labeled. PF is highlighted in red and has the highest density of putative projection neurons to STR in the sub-CTX (n=668890/7 cells/mice). See related Fig. S1, Table 2.1, and Movie 1.
Fig. 2:
Fig. 2:. PF→STR projections are topographically organized.
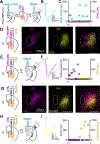
A, Schematic of the experimental design showing a coronal section at +0.9 mm from a WT mouse with 4 injections of 3 CTB variants (cyan, magenta, and yellow) in the STR. B, Coronal section from the ABA at −2.0 mm with PF highlighted in red and the fasciculus retroflexus (FR) circled with a thick black line inside of PF. The FR was used as a landmark to align images across mice. C, Image of a coronal section at −2.0 mm (left) from the experiment shown in A with the inset indicating the region surrounding the PF enlarged on the right. The distributions of CTB conjugated with different fluorophores are largely not overlapping, highlighting the PF→STR topographical organization. D, left, Confocal images of PF excited with indicated wavelengths (top to bottom) highlighting the topographical organization of the PF-STR projections. right, Quantification of fluorescence intensity (FI) for each imaging channel along the medial-lateral axis at coronal section −2.0 mm. Thin lines show peak-normalized data from individual mice and the thick lines the means for each channel (n=3 mice). The grey region represents the FR. Scale bar=250 μm. E-G, Atlas schematics, images, and quantifications as in B-D for coronal sections −2.1 (E), −2.2 (F), and −2.3 (G) mm. The images are from the same mouse shown in (C-D). See related Fig. S2, and Movie 2.
Fig. 3:
Fig. 3:. Transcriptional and electrophysiological characterization of PF neurons.
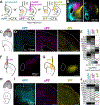
A, left, Image of an acute coronal slice after microdissection of PF. right, Cell suspensions were formed from the dissected tissue and analyzed with inDrops to reveal single cell transcriptomes. B, t-SNE plot showing the main identified cell types (n=10471/8 cells/mice) with excitatory neurons (green) delineated by the oval. C, t-SNE plot of excitatory glutamatergic neurons (Slc17a6-expressing) with the 3 subclusters indicated by different colors (n=992/8 cells/mice). D, ISH from the ABA for Tnnt1 (Cluster 1 and expressed in thalamus outside of PF), Fxyd6 (Cluster 2 and expressed in mPF and ventral dorsal to PF) and Lypd6b (Cluster 3 and expressed throughout PF). E, ISH showing Pdyn expression in mPF. F, Multiple genes show significant correlation or anti-correlation with Pdyn expression on a cell-by-cell basis (left). This analysis reveals Spon1 as being anti-correlated (yellow) with Pdyn and expressed in lPF (middle) whereas other genes, such as Tnc, are markers for cPF (right). G, Schematic of a coronal section at +0.9 mm depicting experimental configurations used to label neurons from mPF and cPF (top) or from cPF and lPF (bottom) that project to STR with CTB. 4 days after injections, whole-cell recordings were made in acute brain slices of PF (green). H, Intrinsic properties (membrane resistance (Rm), capacitance (Cm), and resting voltage (Vrest)) as a function of the location along the medial-lateral axis of the PF. The color indicates that of the CTB in the neuron (grey=unlabeled neurons). The FR is represented by the gray dashed area (n=106/11 cells/mice). I, Voltage transients elicited by 1 s 100 pA current injection in mPF (top, cyan), cPF (middle, magenta), and lPF (bottom, yellow) neurons. J, Frequency of evoked APs (left) and plateau potential (median voltage during the current injection) (right) as functions of current amplitude for mPF (cyan), cPF (magenta) and lPF (yellow) neurons (n=106/11 cells/mice). K, Mean voltage traces for mPF, cPF, and lPF neurons evoked by a 1 s −100 pA injection revealing sag potentials in mPF. The dash line shows that sag is also evoked in mPF neurons with a 250 ms −50 pA injection. See related Fig. S3, and Table 4.1–4.5.
Fig. 4:
Fig. 4:. Prodynorphin expressing cells are located in mPF and target STR matrix.
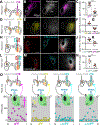
A, Schematic of a coronal section at −2.1 mm from a Pdyn-IRES-Cre mouse depicting an injection of CreOn-GFP (cyan) AAV into the PF. B, left, Coronal section at −2.1 mm showing that expression of GFP (cyan) is restricted to PF. The inset is enlarged (right) and shows medially projecting processes from the GFP-expressing neurons. C, Quantification of FI intensity in PF at coronal section −2.1 mm from images such as in panel B. Thin lines show data from individual mice and the thick lines the mean (n=3 mice). The dashed grey line represents the FR . D, Fraction of GFP+ cells anterior (An) or posterior (Po) to PF and in PF for the experiment shown in A (n=1670/2 cells/mice). E, Image of a coronal section highlighting the STR at +0.9 mm from a mouse manipulated as in panel A. Dorsal STR is separated into sub-regions: Expression of GFP-expressing Pdyn+ axons (cyan) from PF is seen in medial (mSTR) but not dorsal-medial (dmSTR) and dorsal-lateral (dlSTR) STR. F, Quantification of FI in STR of axons from Pdyn+ PF cells at coronal sections between +0.6 mm and +1.2 mm. Thin lines show data from individual mice and the thick line the mean (n=9/3 slices/mice). G, Schematic of a coronal section at −2.1 mm (left) depicting injection of AAV encoding Cre-dependent channelrhodopsin (CreOn-Chr2) into PF of a Pdyn-IRES-Cre mouse. 3 weeks after virus injection whole-cell recordings were obtained in STR (green) at and around coronal section +0.9 mm. H, EPSC amplitudes evoked by optogenetic stimulation of Pdyn+ PF terminals and measured in mSTR, dmSTR, and dlSTR SPNs. For each cell the baseline current (open circle) and EPSC amplitude following a 5 ms light pulse (closed circle) are plotted (n=48/4 cells/mice). Within each striatal region, EPSC amplitude are shown ranked from largest to smallest. Inset shows the mean of 10 light-evoked (blue line) EPSCs from one cell. I, Image of a coronal section of the STR at +0.9 mm with mu opioid receptors (MOR) immunolabeled (red, left) with 3 patches highlighted (white dashed lines). Axons of Pdyn+ PF neurons expressing GFP (center) avoid the MOR-rich patches (overlay, right). J, Quantification of the distribution of FI from GFP labeled PF−mSTR axons in and around the MOR-rich patches. The log of the ratio of the mean MOR and GFP FI in the patch to that in a 100 μm wide ring around the patch (peri-patch) is shown for 38 patches (n=9/3 slices/mice). See related Fig. S4.
Fig. 5:
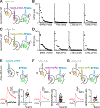
Fig. 5:. The medial, central, and lateral sub-circuits of the PF are not locally interconnected.
A, left, Schematics of a coronal section at −2.1 mm depicting a viral injection of CreOn-ChR2 into the PF of a Pdyn-IRES-Cre mouse. center, Coronal section at +0.9mm depicting CTB injection into dmSTR 3 weeks after the CreOn-ChR2 injection. right, 4 days later acute slices were cut and whole-cell recordings were obtained from ChR2+ or CTB+ cells. B, Example of light-evoked currents in ChR2+ mPF neurons, which are concurrent with the laser pulse. C, EPSC (CTB+ cells, magenta) and ChR2-current amplitudes (ChR2+ cells, cyan) in mPF and cPF evoked by optogenetic stimulation of Pdyn-Cre+ neurons. For each cell, the baseline (white circle) and light-evoked (colored circles) currents elicited by a 5 ms laser pulse (closed circle) are shown (n=28/3 cells/mice). The circles are arranged according to the location of the cell along the medial to lateral direction. No EPSCs were detected in CTB+ cells. D, Experimental design showing a coronal section at +0.9 mm of a WT mouse depicting injection of RV-GFP and CTB into dmSTR and dlSTR, respectively. Images of resulting retrograde labeling in the PF (−2.1 mm) show expression of GFP (magenta) in cPF and CTB (yellow) in lPF. The overlay (right) shows largely not overlapped cell populations (n=3 mice, example shown from one mouse). E, As (D) but with an injection of RV-ChR2 and followed by whole cell recordings from ChR2+ or CTB+ cells 4 days after injections. F, left, As in (B) showing representative ChR2-mediated currents in ChR-+ cPF neurons (magenta). right, As in (C), with summary of amplitudes of light-evoked ChR2-currents (in magenta) and EPSCs (yellow) (n=26/2 cells/mice). No EPSCs were detected in CTB+ cells (yellow). G-I, As in (D-F) but with CTB injected into dmSTR and RV-GFP or RV-ChR2 into dlSTR (Images are from 1 of 3 representative mice. For electrophysiological analysis n=19/2 cells/mice). See related Fig. S5.
Fig. 6:
Fig. 6:. PF→striatum neurons send topographically-organized projection to CTX
A, Schematics of the intersectional strategies in Pdyn-IRES-Cre mice used to express GFP in subsets of PF→STR neurons. left, Injection of CreOn-GFP (cyan) into PF results in expression of GFP in the medial Pdyn+ neurons. Injection of retro-Flp (black) in dmSTR (center) or dlSTR (right) and CreOff-FlpOn-GFP (magenta) into PF achieves expression in cPF or lPF, respectively, while avoiding it in Pdyn+ neurons. B, Overlay of 1 brain section of each of 3 brains targeted with the labeling strategies depicted in (A) at coronal section −2.1 mm in PF (left) and at +0.9 mm in STR (right). C, top, For the analysis of the distribution of GFP+ axons in CTX, a region spanning from 0.6 to 1.2 mm anterior posterior was taken (red). bottom, Regions of interest were chosen spanning the medial lateral portion of CTX as demarcated by dashed lines. D, Representative coronal sections from the posterior region of CTX (0.9 mm) for each of the labeling strategies (left: mPF→CTX; center: cPF→CTX; right: lPF→CTX) highlighting the differential projections to medial, central, and lateral parts of CTX, respectively. CC=corpus callosum. E, Example quantification of the relative axon density (RAD) of PF axons arising from each subregion measured in each of 11 cortical regions. The log(RAD) per region is represented by the gray scale spanning ±0.75 log units. An X indicates a cortical region not present in the analyzed slice. F, Experimental design showing a coronal section at 0.9 mm depicting an injection of CTB into MOs (left) and the resulting labeling in cPF at the −2.1 mm coronal section (right). G, As in (F) but targeting SSp with CTB (left) resulting in labeling in lPF (right). H-J, As in (C-E) but showing the RAD in an anterior section in CTX spanning 2.5 to 3.1 mm. The images shown in (B,D,I) are from the same mouse. See related Fig. S6, Movie 3, 4 and Table 2.2.
Fig. 7:
Fig. 7:. Cortical Layer 5 projections to PF are topographically organized and form closed CTX-PF-STR circuits
A, Schematic of coronal sections at +0.9 mm from an Rbp4-Cre mouse depicting injection of CreOn-GFP (white) into layer 5 of secondary motor CTX (MOs) followed by of CTB (magenta) into dmSTR 3 weeks later. B, Coronal section at −2.1 mm in PF showing the results of the experiment in (A). CTB (magenta) and GFP-expressing axons from MOs (white) are seen to overlapping in cPF. The ROI in the CTB channel (white dashed line) was manually drawn and applied to the GFP channel to measure the FI distribution. C, Quantification of % of the maximal GFP FI in the cPF ROI, as shown in (B), compared to that in the rest of PF (rPF). Grey filled circles here (and throughout the figure) show data from coronal section −2.3 mm in PF (n=12/3 slices/mice; P=0.0001; Wilcoxon test). D-E, As in (A-B) but with injection of CreOn-GFP into primary sensory CTX (SSp) (white) and CTB (yellow) into dlSTR. F, left, Quantification of % of the maximal FI of GFP labeled axons in the lPF ROI, as shown in (E), compared to that in the rest of PF (rPF) on a log scale (n=8/2 slices/mice). G, As in (F) but following injection of CreOn-GFP into primary SSp and CTB (yellow) into dmSTR and not dlSTR resulting in CTB in the cPF→dmSTR projections. This confirmed the specificity of SSp→lPF projection topography (n=1½ slices/mice). H-J, As in (D-F) but for injection of CreOn-GFP into PFC (white) and CTB into mSTR (cyan) and ACB (red) (n=12/2 slices/mice). K, As in (G) but with an injection of CreOn-GFP into PFC and CTB into dmSTR. This confirmed the specificity of PFC→mPF axon topography (n=10/2 slices/mice). L-N, As in (A-C) but for injection of CreOn-GFP into PFC and CTB into mSTR and ACB CONTRA to the injection in PFC (n=10/2 slices/mice; P=0.002, Wilcoxon test). O, top, Schematics of 4 experimental paradigms using Rbp4-Cre mice indicating the sites of injection of CreOn-ChR2 into CTX and CTB into STR 3 weeks later. Acute slices were cut (bottom) and ChR2-evoked corticothalamic EPSCs were measured in CTB+ neurons in cPF (n=13/2; cells/mice), lPF (n=13/2), mPF IPSI (i-mPF n=23/3) and CONTRA (c-mPF n=15/2) to the cortical injection. The amplitudes of the ESPC (open circles) and equivalent analysis during a baseline period (closed circles) are shown as in previous figures. Overlay of 10 APs from a cell in cPF (magenta) highlighting that the CTX→PF terminals are sufficient to spike PF neurons. Example EPSCs are shown for lPF (yellow) and mPF (cyan) cells. Grey filled circles in C, F, G, J, K, N represent the analyses of coronal section −2.3 mm in PF. See related Figures S7 and S8.
Fig. 8:
Fig. 8:. Differential modulation of STR neurons by PF sub-classes
A, Schematic of coronal sections at +0.9 mm from a Lhx6-EGFP mouse injected with retro-Cre (white) in dmSTR and CreOn-ChR2 (magenta) in PF. 3 weeks later acute slices were cut and ChR2-evoked cPF→dmSTR EPSCs were measure. B, Amplitudes of EPSC from (left to right) SPNs, FSI, LTSI, and TANs in dmSTR. The amplitudes of the ESPC (open circles) and noise during a baseline period (closed circles) are shown (n=5 mice). C-D, As in (A-B) but with injections of retro-Cre (white) in dlSTR and CreOn-ChR2 (yellow) in PF (n=7 mice). E, top, Schematic of coronal sections at −2.1 mm from a Pdyn-IRES-Cre mouse injected with CreOn-Chr2 in PF. 3 weeks later whole-cell recordings were obtained in STR (highlighted in green). Light-evoked EPSCs were recorded at −70 mV and at a holding potential 20 mV above the EPSC the reversal potential in each cell. Bottom left: representative traces of NMDA (red) and AMPA (black) receptor mediated EPSCs. Bottom right: summary data (n=17/2 cells/mice). F-G, As in (E) but for injection of retro-Cre in dmSTR (F) or dlSTR (G) followed by injection of CreOn-ChR2 into PF. For F: n=4¾ and G: n=19/3 cells/mice.

References

    1. Aceves Buendia J. de J., Tiroshi L, Chiu W-H, Goldberg JA, 2017. Selective remodeling of glutamatergic transmission to striatal cholinergic interneurons after dopamine depletion. Eur. J. Neurosci. 18, 63. doi:10.1111/ejn.13715 - DOI - PMC - PubMed
    1. Alloway KD, Smith JB, Watson GDR, 2014. Thalamostriatal projections from the medial posterior and parafascicular nuclei have distinct topographic and physiologic properties. J. Neurophysiol. 111, 36–50. doi:10.1152/jn.00399.2013 - DOI - PMC - PubMed
    1. Assous M, Kaminer J, Shah F, Garg A, Koós T, Tepper JM, 2017. Differential processing of thalamic information via distinct striatal interneuron circuits. Nat Commun 8, 15860. doi:10.1038/ncomms15860 - DOI - PMC - PubMed
    1. Berendse HW, Groenewegen HJ, 1990. Organization of the thalamostriatal projections in the rat, with special emphasis on the ventral striatum. J. Comp. Neurol. 299, 187–228. doi:10.1002/cne.902990206 - DOI - PubMed
    1. Beyeler A, Chang C-J, Silvestre M, Lévêque C, Namburi P, Wildes CP, Tye KM, 2018. Organization of Valence-Encoding and Projection-Defined Neurons in the Basolateral Amygdala. Cell Rep 22, 905–918. doi:10.1016/j.celrep.2017.12.097 - DOI - PMC - PubMed

Publication types