. 2019 Apr 4;104(4):611-624.
doi: 10.1016/j.ajhg.2019.02.008. Epub 2019 Mar 21.

Disease Heritability Enrichment of Regulatory Elements Is Concentrated in Elements with Ancient Sequence Age and Conserved Function across Species

Affiliations

Disease Heritability Enrichment of Regulatory Elements Is Concentrated in Elements with Ancient Sequence Age and Conserved Function across Species

Margaux L A Hujoel et al. Am J Hum Genet. .

Abstract

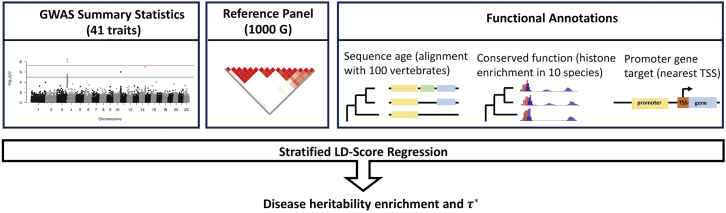
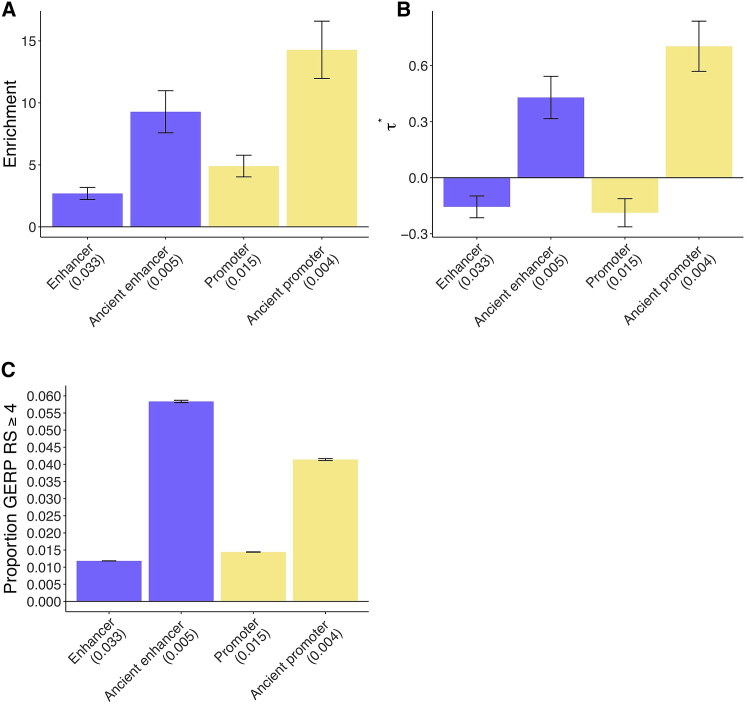
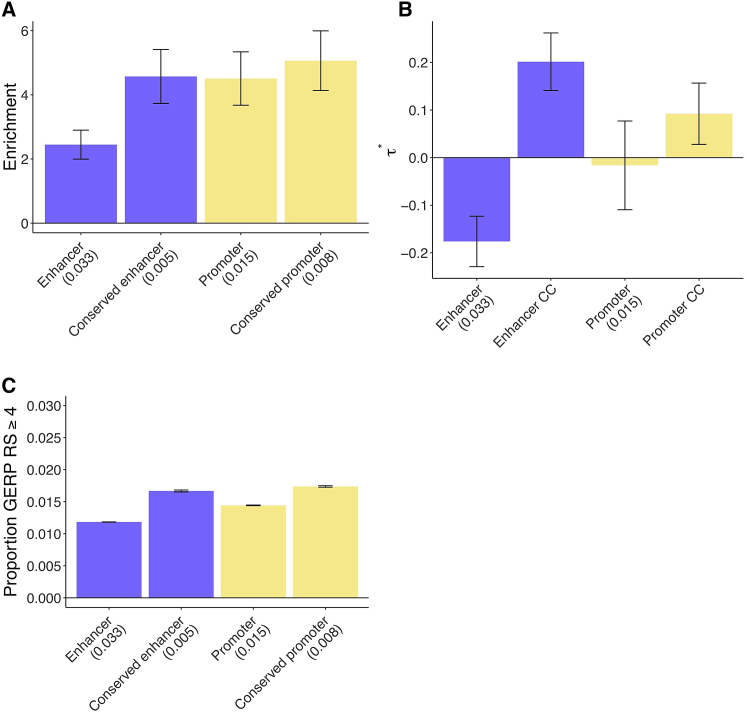
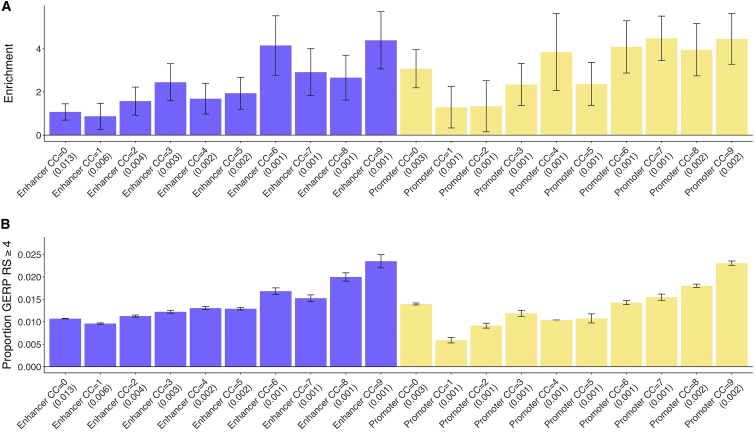
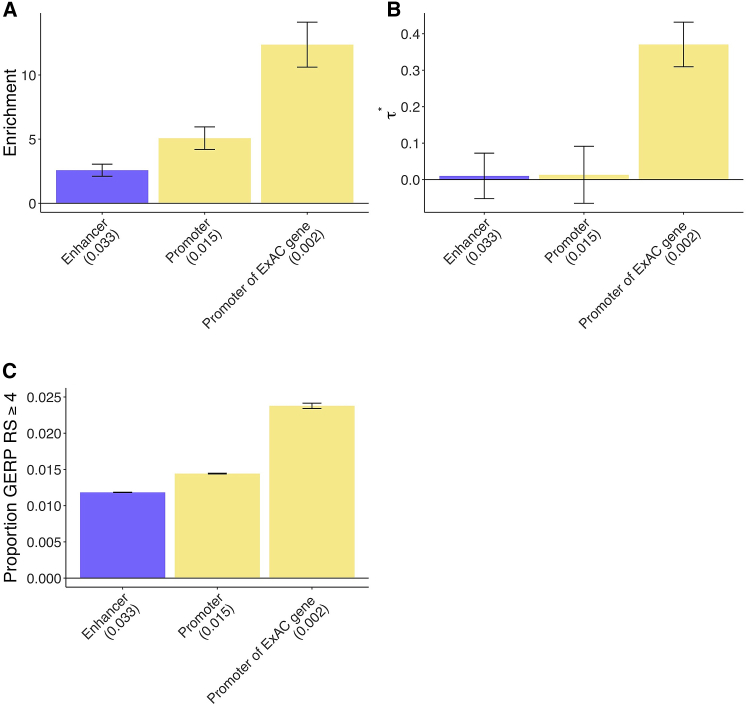
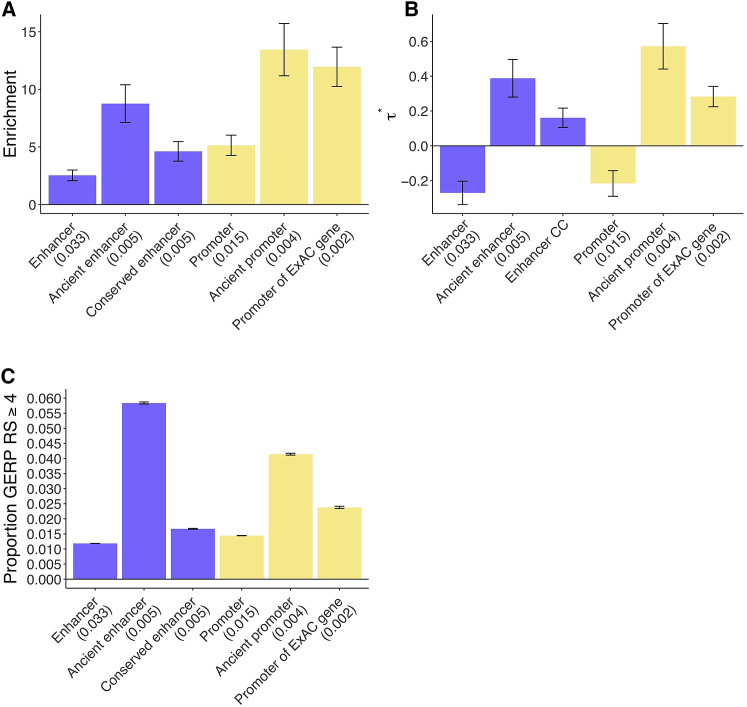
Regulatory elements, e.g., enhancers and promoters, have been widely reported to be enriched for disease and complex trait heritability. We investigated how this enrichment varies with the age of the underlying genome sequence, the conservation of regulatory function across species, and the target gene of the regulatory element. We estimated heritability enrichment by applying stratified LD score regression to summary statistics from 41 independent diseases and complex traits (average N = 320K) and meta-analyzing results across traits. Enrichment of human putative enhancers and promoters was larger in elements with older sequence age, assessed via alignment with other species irrespective of conserved functionality: putative enhancer elements with ancient sequence age (older than the split between marsupial and placental mammals) were 8.8× enriched (versus 2.5× for all putative enhancers; p = 3e-14), and promoter elements with ancient sequence age were 13.5× enriched (versus 5.1× for all promoters; p = 5e-16). Enrichment of human putative enhancers and promoters was also larger in elements whose regulatory function was conserved across species, e.g., human putative enhancers that were enhancers in ≥5 of 9 other mammals were 4.6× enriched (p = 5e-12 versus all putative enhancers). Enrichment of human promoters was larger in promoters of loss-of-function intolerant genes: 12.0× enrichment (p = 8e-15 versus all promoters). The mean value of several measures of negative selection within these genomic annotations mirrored all of these findings. Notably, the annotations with these excess heritability enrichments were jointly significant conditional on each other and on our baseline-LD model, which includes a broad set of coding, conserved, regulatory, and LD-related annotations.

Keywords: enhancer; genetic architecture; heritability; promoter; regulatory elements.


Figures

Figure 1
Figure 1
Data Sources Used in Analyses New functional annotations are constructed using a variety of previous research., , By applying stratified LD score regression including both these annotations and the baseline-LD model, to summary association statistics from 41 independent diseases and complex traits (average N = 320K), we can determine the disease heritability enrichment and standardized effect size for annotations of interest.
Figure 2
Figure 2
Disease Enrichment of Ancient Enhancers and Ancient Promoters in Sequence Age Model We report results for sequence age annotations that are jointly significant conditional on the baseline-LD model and putative enhancer and promoter annotations (Bonferroni p = 0.05/4 = 0.0125). (A and B) Heritability enrichment (A) and τ estimates (±1.96 standard error) (B); results are meta-analyzed across 41 traits. (C) Proportion of common SNPs within annotations with GERP RS ≥ 4, (±1.96 standard error). We report the proportion of common SNPs (MAF ≥ 0.05) for each annotation. Numerical results are reported in Table S7, and results for each trait are reported in Table S8.
Figure 3
Figure 3
Disease Enrichment of Conserved Enhancers and Conserved Promoters in Conserved Function Model We report results for conserved function annotations that are jointly significant conditional on the baseline-LD model and putative enhancer and promoter annotations (Bonferroni p = 0.05/8 = 0.00625). (A and B) Heritability enrichment (A) and τ estimates (±1.96 standard error) (B); results are meta-analyzed across 41 traits. CC denotes conservation count. (C) Proportion of common SNPs within annotations with GERP RS ≥ 4, (±1.96 standard error). We report the proportion of common SNPs (MAF ≥ 0.05) for each annotation. Numerical results are reported in Table S15, and results for each trait are reported in Table S16.
Figure 4
Figure 4
Disease Enrichment of Putative Enhancers and Promoters as a Function of Conservation Count (CC) (A) Heritability enrichment (±1.96 standard error); results are meta-analyzed across 41 traits. (B) Proportion of common SNPs within annotations with GERP RS ≥ 4, (±1.96 standard error). We report the proportion of common SNPs (MAF ≥ 0.05) for each annotation. Numerical results are reported in Table S17, and results for each trait are reported in Table S18.
Figure 5
Figure 5
Disease Enrichment of Promoters of ExAC Genes in Gene Function Model We report results for the gene function annotation that is significant conditional on the baseline-LD model and putative enhancer and promoter annotations (Bonferroni p = 0.05/3 = 0.0167). “ExAC genes” refer to genes annotated as having high pLI in ExAC data. (A and B) Heritability enrichment (A) and τ estimates (±1.96 standard error) (B); results are meta-analyzed across 41 traits. (C) Proportion of common SNPs within annotations with GERP RS ≥ 4, (±1.96 standard error). We report the proportion of common SNPs (MAF ≥ 0.05) for each annotation. Numerical results are reported in Table S24, and results for each trait are reported in Table S25.
Figure 6
Figure 6
Disease Enrichment of Annotations in Combined Joint Model We report results for sequence age, conserved function, and gene function annotations that are jointly significant conditional on the baseline-LD model and putative enhancer and promoter annotations (Bonferroni p = 0.05/15 = 0.0033). (A) Heritability enrichment and (B) τ estimates (±1.96 standard error); results are meta-analyzed across 41 traits. CC denotes conservation count. (C) Proportion of common SNPs within annotations with GERP RS ≥ 4, (±1.96 standard error). We report the proportion of common SNPs (MAF ≥ 0.05) for each annotation. Numerical results are reported in Table S29, and results for each trait are reported in Table S30.

References

    1. Maurano M.T., Humbert R., Rynes E., Thurman R.E., Haugen E., Wang H., Reynolds A.P., Sandstrom R., Qu H., Brody J. Systematic localization of common disease-associated variation in regulatory DNA. Science. 2012;337:1190–1195. - PMC - PubMed
    1. Trynka G., Sandor C., Han B., Xu H., Stranger B.E., Liu X.S., Raychaudhuri S. Chromatin marks identify critical cell types for fine mapping complex trait variants. Nat. Genet. 2013;45:124–130. - PMC - PubMed
    1. Pickrell J.K. Joint analysis of functional genomic data and genome-wide association studies of 18 human traits. Am. J. Hum. Genet. 2014;94:559–573. - PMC - PubMed
    1. Farh K.K.-H., Marson A., Zhu J., Kleinewietfeld M., Housley W.J., Beik S., Shoresh N., Whitton H., Ryan R.J., Shishkin A.A. Genetic and epigenetic fine mapping of causal autoimmune disease variants. Nature. 2015;518:337–343. - PMC - PubMed
    1. Kundaje A., Meuleman W., Ernst J., Bilenky M., Yen A., Heravi-Moussavi A., Kheradpour P., Zhang Z., Wang J., Ziller M.J., Roadmap Epigenomics Consortium Integrative analysis of 111 reference human epigenomes. Nature. 2015;518:317–330. - PMC - PubMed

Publication types