. 2019 Apr 1;29(7):1100-1111.e4.
doi: 10.1016/j.cub.2019.02.020. Epub 2019 Mar 21.

Dynamic Theta Networks in the Human Medial Temporal Lobe Support Episodic Memory

Affiliations

Dynamic Theta Networks in the Human Medial Temporal Lobe Support Episodic Memory

Ethan A Solomon et al. Curr Biol. .

Abstract

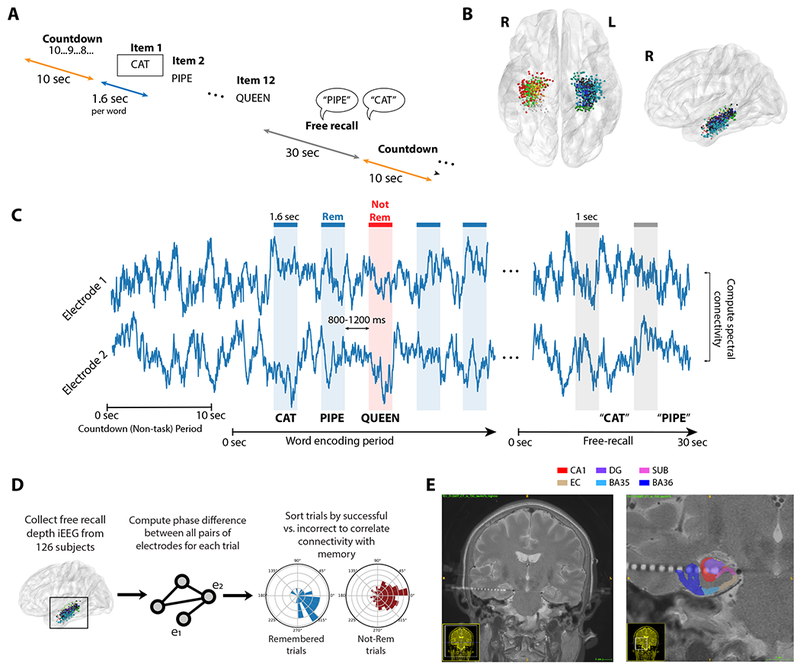
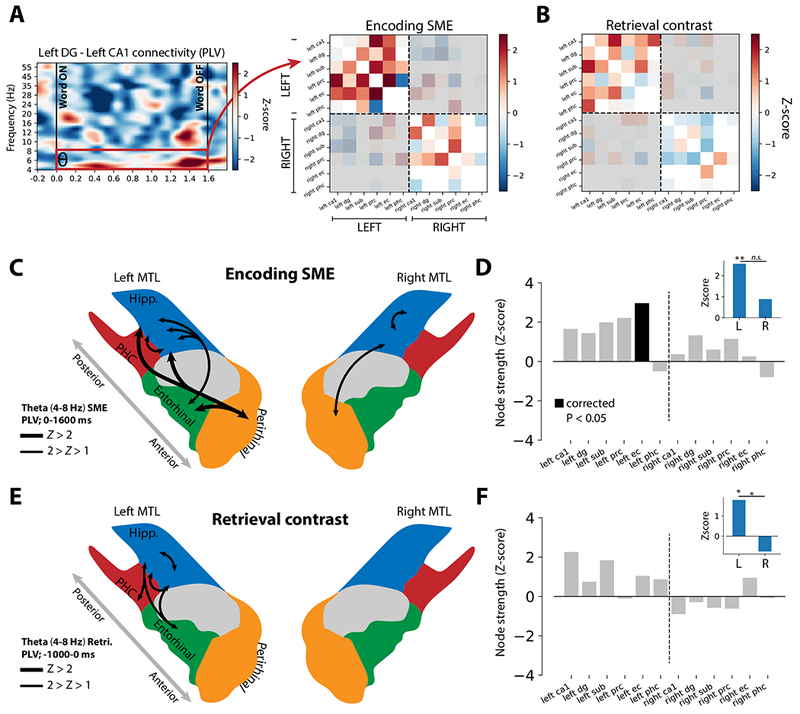
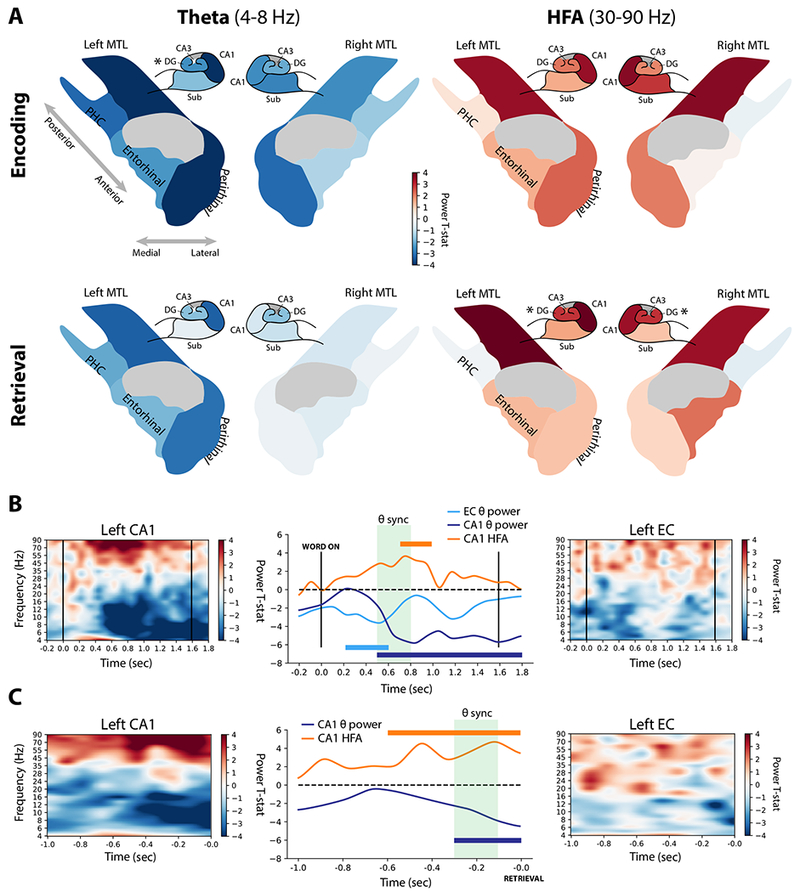
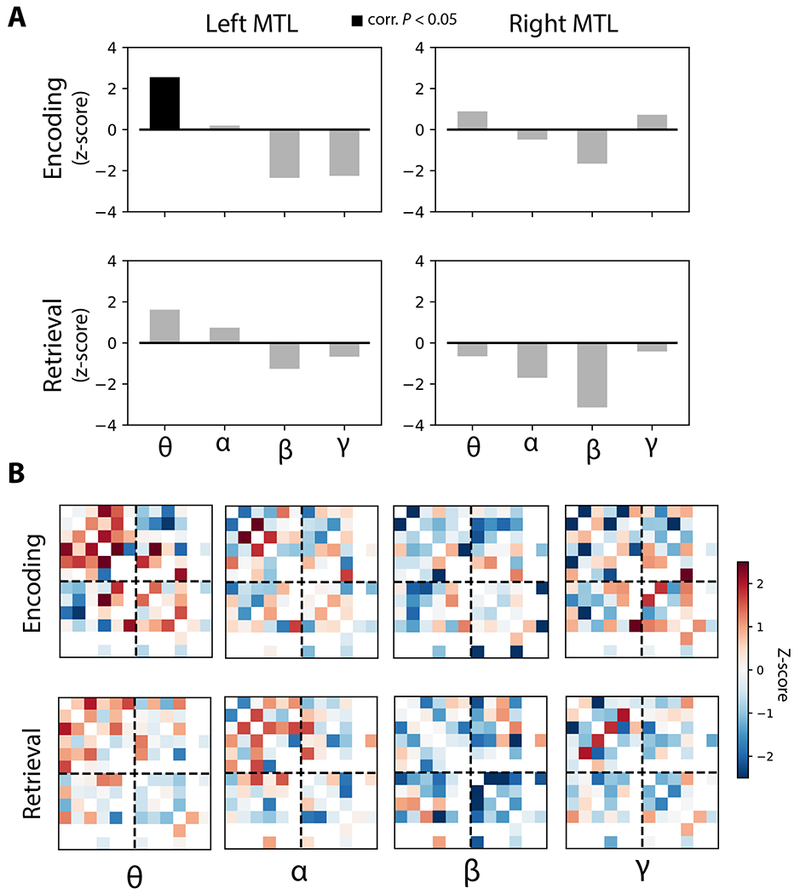
The medial temporal lobe (MTL) is a locus of episodic memory in the human brain. It is comprised of cytologically distinct subregions that, in concert, give rise to successful encoding and retrieval of context-dependent memories. However, the functional connections between these subregions are poorly understood. To determine functional connectivity among MTL subregions, we had 131 subjects fitted with indwelling electrodes perform a verbal memory task and asked how encoding or retrieval correlated with inter-regional synchronization. Using phase-based measures of connectivity, we found that synchronous theta (4-8 Hz) activity underlies successful episodic memory. During encoding, we observed a dynamic pattern of connections converging on the left entorhinal cortex, beginning with the perirhinal cortex and shifting through hippocampal subfields. Retrieval-associated networks demonstrated enhanced involvement of the subiculum and CA1, reflecting a substantial reorganization of the encoding network. We posit that coherent theta activity within the MTL marks periods of successful memory, but distinct patterns of connectivity dissociate key stages of memory processing.

Keywords: ECoG; LFP; connectivity; entorhinal cortex; episodic memory; hippocampus; networks; theta.


Conflict of interest statement

Declaration of Interests

The authors declare no competing interests.

Figures

Figure 1.
Figure 1.. Task structure and analysis methods.
A. Subjects performed a verbal free-recall task, consisting of alternating periods of pre-list countdowns (orange), word encoding (blue), and free-recall (gray). See Methods for details. B. 131 subjects with indwelling electrodes in the medial temporal lobe (MTL) participated. Electrodes were localized to CA1, dentate gyrus (DG), subiculum (Sub), perirhinal cortex (PRC), entorhinal cortex (EC), or parahippocampal cortex (PHC). Each dot shows an electrode in this dataset, colored by MTL subregion. C. To construct networks of intra-MTL activity, we used the PLV to analyze phase differences between electrode pairs. Time windows in two conditions were analyzed: 1.6-second epochs during word encoding (blue/red), and 1-second periods leading up to recall vocalizations (gray). D. To assess intra-MTL connectivity, phase differences were computed for each electrode pair in all trials, and trials were then sorted by successful vs. unsuccessful memory. PLV was computed for each distribution, and a nonparametric permutation procedure was used to determine whether connectivity is significantly different between distributions. Connectivity values were averaged across electrode pairs and subjects to yield the final MTL network maps depicted in Figure 2 (see Methods for details). E. Example subject MRI with post-operative CT and segmentations overlaid to demonstrate placement of depth electrodes in the MTL. See Figure S1-B for additional examples. BA35/36 were combined to form our PRC label. See also Figure S1 and Table S1.
Figure 2.
Figure 2.. Structure of theta networks supporting episodic memory.
A. To determine overall connectivity for each pair of MTL subregions, PLV was averaged over the encoding (word presentation, 0-1.6 seconds) or retrieval (−1.0 to 0 seconds prior to retrieval onset) intervals, yielding a single z-scored connection weight. (see Methods for details). The matrix representation of all these weights is called an adjacency matrix, shown here for the encoding contrast in the theta band (4-8 Hz). Any inter-regional connection with fewer than 5 subjects’ worth of data is excluded from analysis (white cells). Because interhemispheric connections are less well sampled than intra-hemispheric connections (Figure S1), and because interhemispheric connectivity is largely asynchronous, they are excluded from this analysis of network structure (gray shading). B. Retrieval contrast theta adjacency matrix, organized as in (A). C. Depiction of strongest (Z > 1) synchronous PLV connectivity in the SME contrast, derived from the theta adjacency matrix in (A). These connections reflect the averaged connection strength over the word presentation interval (0.0-1.6 seconds; see Methods for details). Thicker lines reflect Z-scores above 2. D. Z-scored node strength for each MTL region, computed only for connections to ipsilateral MTL regions (see Methods for details). Node strength indicates the sum of all connections to a given region, with positive Z-scores indicating enhanced overall connectivity to a given region during successful encoding epochs (a “hub” of connectivity). Left EC exhibited significant positive node strength (FDR-corrected permuted P < 0.05) correlated with words that were successfully remembered. Inset: Z-scored total network strength for all intra-hemispheric MTL connections, computed by summing the connection weights for each hemisphere’s MTL subregions separately. Intra-MTL connections on the left are significantly greater than chance (P = 0.005), and trend greater than right-sided connections (P = 0.15). E. Schematic of strongest theta retrieval connections, reflecting increased PLV between two MTL subregions in the 1-second immediately prior to successful retrieval of a word item. F. Same as (D), but reflecting synchronous activity from the 1-second period prior to successful retrieval of a word item. No region exhibits a significant node strength after correction for multiple comparisons, but left CA1 is significant if uncorrected (P = 0.013). Inset: Z-scored total network strength for all intra-hemispheric MTL connections. Left-sided connections are significantly greater than chance (P = 0.04) and significantly greater than right-sided connections (P = 0.03).
Figure 3.
Figure 3.. Time-varying dynamics of memory-related synchronization in the left MTL.
A. Theta synchronization during early (0-400 ms), middle (400-800 ms) and late (800-1200 ms) epochs of the encoding interval, during which words to be remembered are presented on the screen. Top: Schematic representation of synchronization among left MTL subregions, contrasting successful vs. unsuccessful encoding (i.e. encoding SME). Yellow lines indicate connections of permuted P < 0.05 significance; red lines indicate P < 0.01 significance. Bottom: Adjacency matrix representation of the encoding SME in the left MTL; red colors indicate a relative synchronization for successful encoding events. B. Theta synchronization during early (1000 to −500 ms) and late (−500 to 0 ms) epochs of the pre-retrieval period, relative to matched deliberation intervals. Structured as in (A).
Figure 4.
Figure 4.. Timing analysis of key encoding connections to the left EC.
A. The timecourse of encoding-related synchronization is depicted for each connection where significant connectivity was observed in the average (see Figure 3). Blue shaded areas are indicated wherever two or more consecutive P < 0.05 time windows occur (see Methods for details). B. Time-frequency spectrogram contrasts, averaged over subjects, for each significant EC connection. Vertical lines indicate word onset. See also Figure S2, Figure S3, and Figure S4.
Figure 5.
Figure 5.. Timing analysis of key retrieval connections.
A. Left: Time-frequency spectrogram of left CA1-subiculum PLV synchronization in the retrieval contrast, averaged across subjects. Right: Time-frequency spectrogram of left CA1-EC PLV synchronization in the retrieval contrast. B. Left: Timecourse of left CA1-subiculum PLV synchronization, organized as in Figure 4B. Significant (P < 0.05) PLV synchronization is marked from −200 to 0 ms prior to recall onset. Right: Timecourse of left CA1-EC synchronization. Significant PLV synchronization is marked from −300 to −100 ms prior to recall onset. See also Figure S2.
Figure 6.
Figure 6.. Dynamics of spectral power associated with memory encoding and retrieval.
A. For each MTL subregion and hippocampal subfield, the spectral power during successful vs. unsuccessful encoding or retrieval epochs was computed in the theta (4-8 Hz) and high-frequency activity (30-90 Hz) bands. For encoding periods, powers were averaged in the 400-1100 ms interval, and between −500-0 ms for retrieval periods, which were the times featuring the most prominent network-wide power change (see Methods for details). The t-statistic indicating the relative power during successful versus unsuccessful encoding or retrieval is mapped to a color, with reds indicating increased power and blues indicating decreased power. These colors are displayed on schematics of MTL and hippocampal anatomy for encoding and retrieval conditions (rows), and theta or HFA bands (columns). Asterisks indicate significant (P < 0.05) memory-related power modulation, FDR corrected across tested regions. “Hipp” was not tested collectively but is colored according to CA1. B. Left CA1 (N = 19) and left EC (N = 57) showed changes in spectral power that were temporally associated with enhanced connectivity between the regions (see Figure 5B). Significant (P < 0.05) increases in CA1 HFA occurred from 700-1000 ms after word onset, while CA1 theta power decreased from 500 ms to the end of the word encoding interval. Left EC theta power decreased from 200-600 ms. The period of significantly enhanced theta PLV is marked in green. C. Organized as (B), but for the EC-CA1 interactions in the retrieval contrast. No significant modulations of left EC power were observed in the pre-recall interval. See also Figure S5.
Figure 7.
Figure 7.. Network-wide synchrony by frequency band.
A. Network-wide synchronization is computed by averaging all inter-regional connection weights within the right and left MTL, for each task contrast, and comparing the average to a null distribution (see Methods for details). Network-wide synchronization was observed in the left MTL in the theta band for the encoding contrast, FDR-corrected for multiple comparisons (permuted P < 0.05). B. Adjacency matrix representation of the MTL network for each frequency band and task contrast. Red colors indicate a memory-related synchronization. Matrices organized as in Figure 2. See also Figure S4 and Figure S6.

Similar articles

Cited by

References

    1. Eichenbaum H (2000). A cortical-hippocampal system for declarative memory. Nat. Rev. Neurosci 1, 41–50. - PubMed
    1. Paller KA, and Wagner AD (2002). Observing the transformation of experience into memory. Trends Cogn. Sci 6, 93–102. - PubMed
    1. Solomon EA, Kragel JE, Sperling MR, Sharan A, Worrell G, Kucewicz M, Inman CS, Lega B, Davis KA, Stein JM, et al. (2017). Widespread theta synchrony and high-frequency desynchronization underlies enhanced cognition. Nat. Commun 8, 1704. - PMC - PubMed
    1. Ranganath C, Heller A, Cohen MX, Brozinsky CJ, and Rissman J (2005). Functional connectivity with the hippocampus during successful memory formation. Hippocampus 15, 997–1005. - PubMed
    1. Vincent JL, Snyder AZ, Fox MD, Shannon BJ, Andrews JR, Raichle ME, and Buckner RL (2006). Coherent Spontaneous Activity Identifies a Hippocampal-Parietal Memory Network. J. Neurophysiol 96, 3517–3531. - PubMed

Publication types

LinkOut - more resources