. 2019 Apr 4;24(4):551-565.e8.
doi: 10.1016/j.stem.2019.02.019. Epub 2019 Mar 21.

Precise Gene Editing Preserves Hematopoietic Stem Cell Function following Transient p53-Mediated DNA Damage Response

Affiliations

Precise Gene Editing Preserves Hematopoietic Stem Cell Function following Transient p53-Mediated DNA Damage Response

Giulia Schiroli et al. Cell Stem Cell. .

Abstract

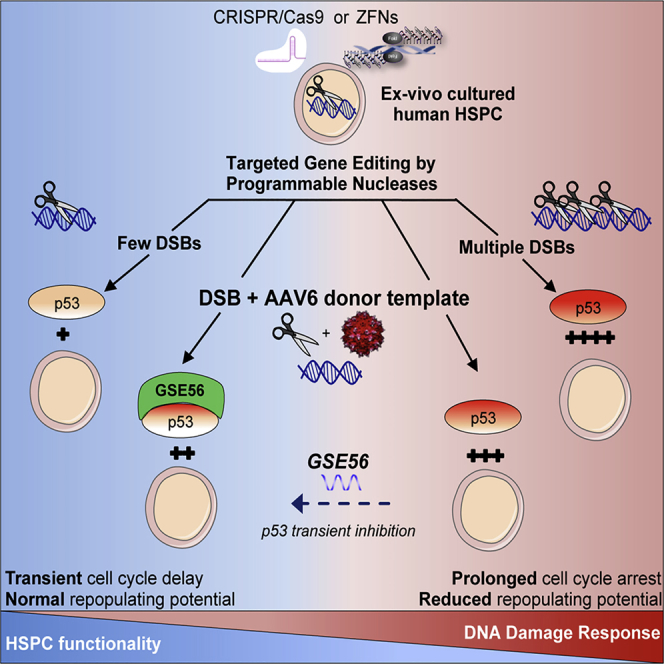
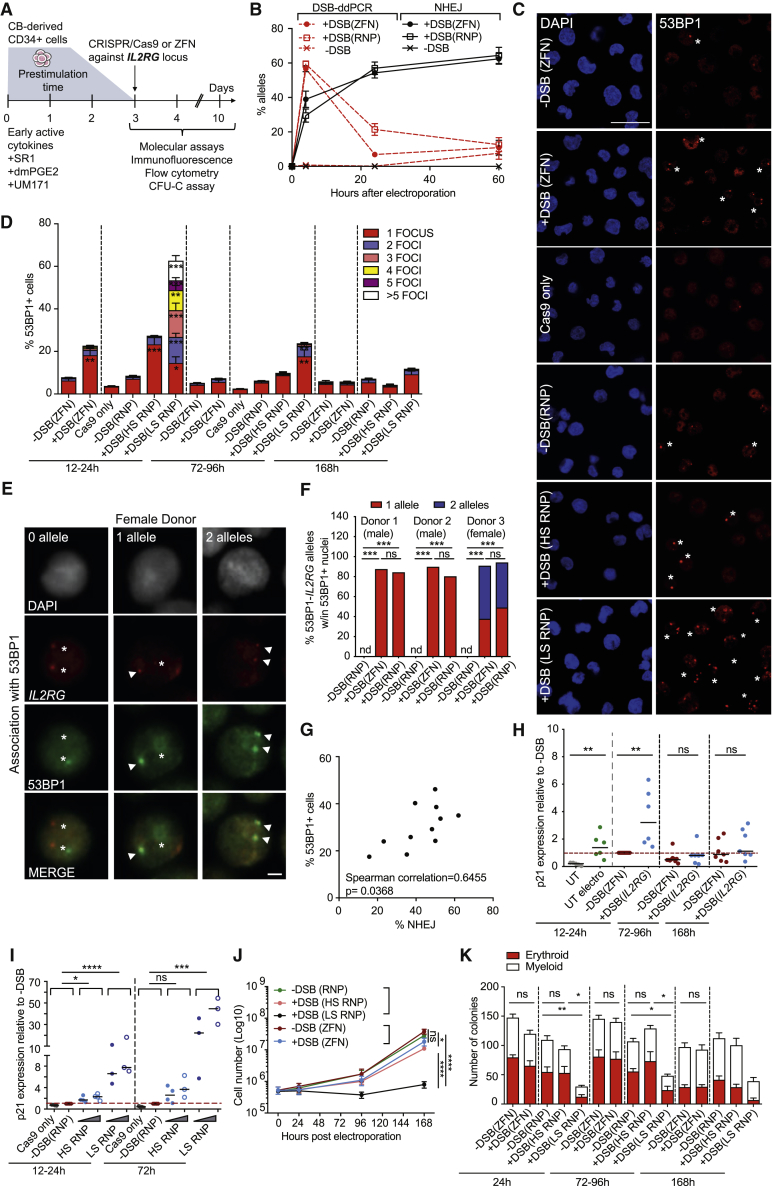
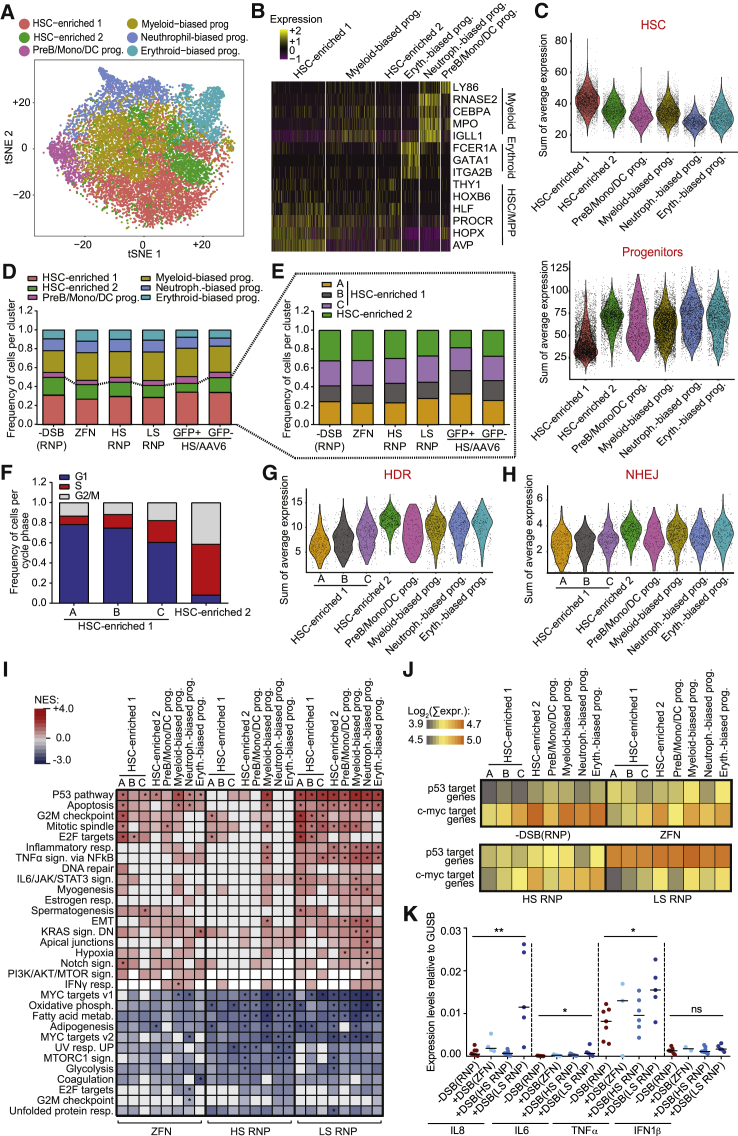
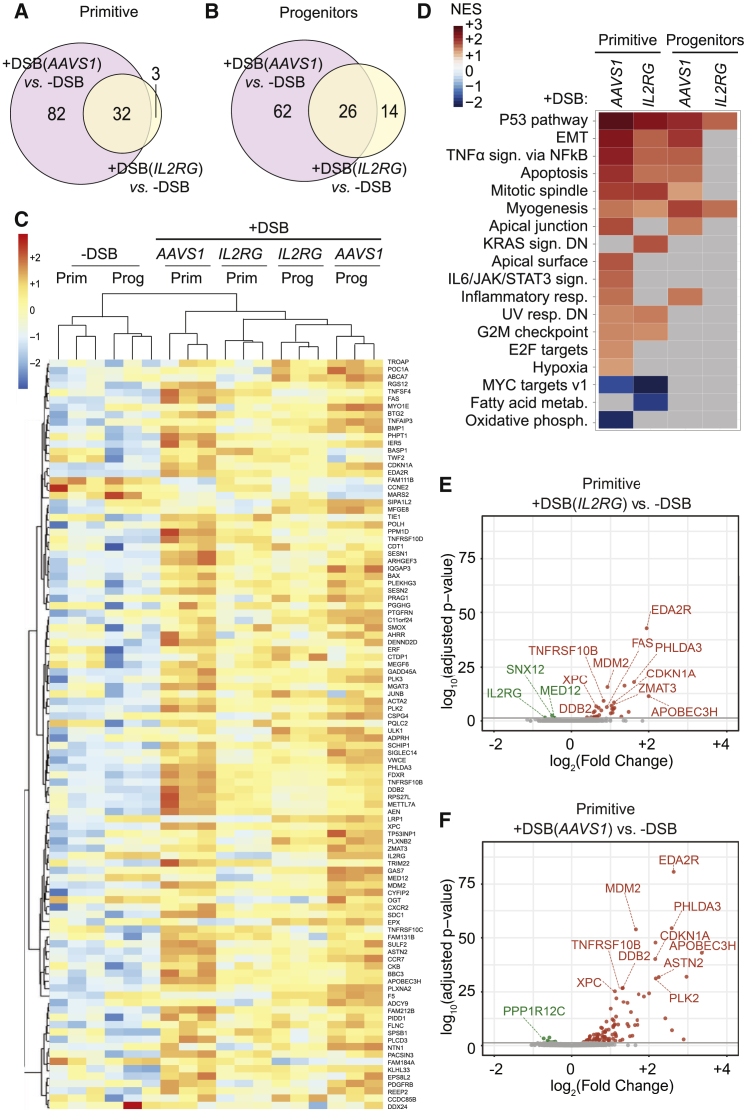
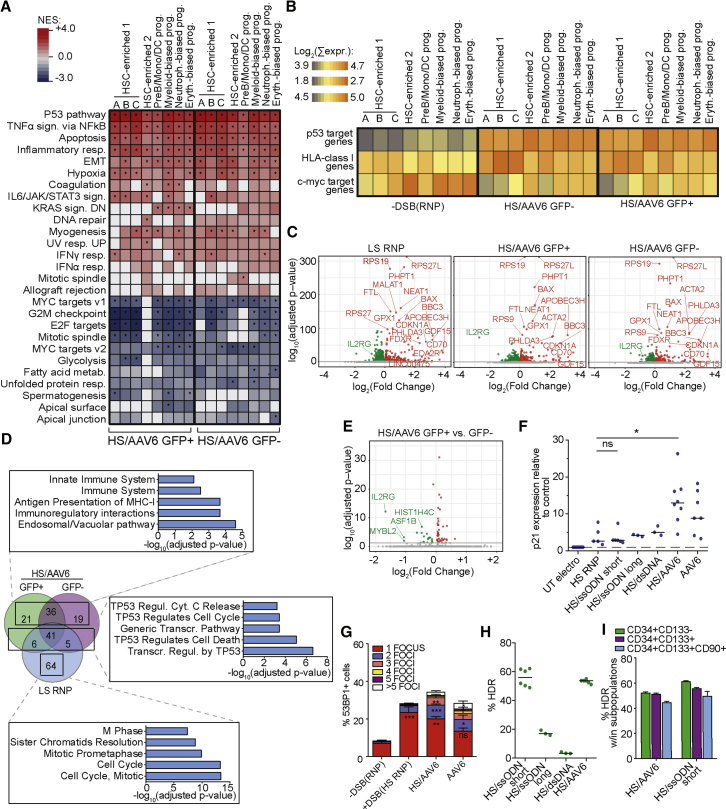
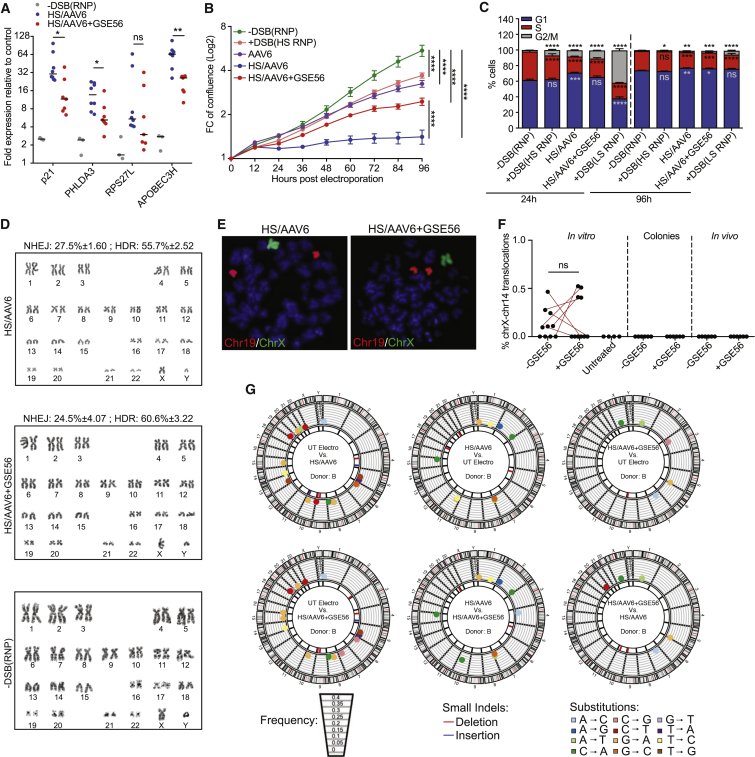
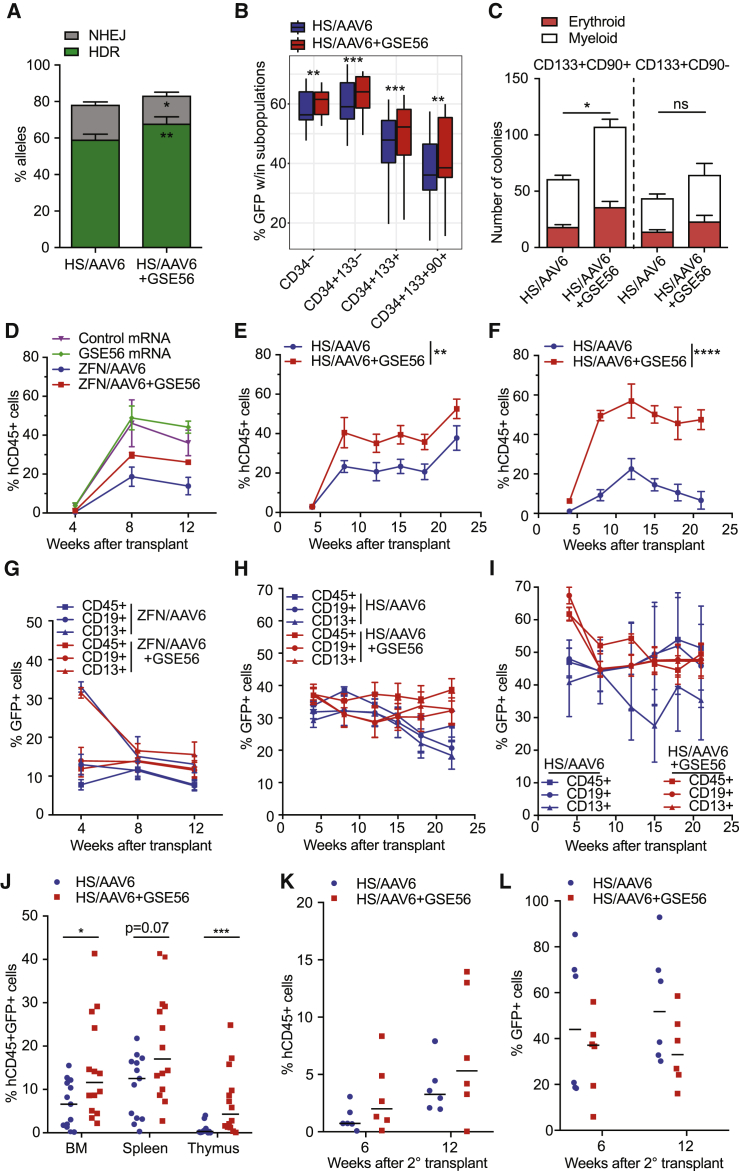
Precise gene editing in hematopoietic stem and progenitor cells (HSPCs) holds promise for treating genetic diseases. However, responses triggered by programmable nucleases in HSPCs are poorly characterized and may negatively impact HSPC engraftment and long-term repopulation capacity. Here, we induced either one or several DNA double-stranded breaks (DSBs) with optimized zinc-finger and CRISPR/Cas9 nucleases and monitored DNA damage response (DDR) foci induction, cell-cycle progression, and transcriptional responses in HSPC subpopulations, with up to single-cell resolution. p53-mediated DDR pathway activation was the predominant response to even single-nuclease-induced DSBs across all HSPC subtypes analyzed. Excess DSB load and/or adeno-associated virus (AAV)-mediated delivery of DNA repair templates induced cumulative p53 pathway activation, constraining proliferation, yield, and engraftment of edited HSPCs. However, functional impairment was reversible when DDR burden was low and could be overcome by transient p53 inhibition. These findings provide molecular and functional evidence for feasible and seamless gene editing in HSPCs.

Keywords: DNA damage response; DNA double strand breaks; adeno-associated vector; genome editing; hematopoietic stem and progenitor cells; p53 pathway; programmable nucleases.


Figures

None
Graphical abstract
Figure 1
Figure 1
DNA DSBs Induced by Programmable Nucleases Transiently Activate DDR in HSPCs (A) Gene editing protocol and cell analyses. (B) Percentage of IL2RG alleles containing a DSB (DSB-ddPCR) or indels (NHEJ; n = 3). (C) Confocal images of 53BP1 foci (red) and DAPI (blue) in HSPCs treated with IL2RG ZFN monomers (−DSB(ZFN)), ZFN heterodimers (+DSB(ZFN)), unloaded Cas9 (Cas9 only), RNP with no predicted activity (−DSB(RNP)), and RNP with higher (+DSB(HS RNP)) or lower (+DSB(LS RNP)) specificity 24 h post-treatment. Asterisks indicate foci-positive cells. Scale bar represents 20 μm. (D) Quantification of 53BP1 foci from (C); 12–24 h: n = 10, 7, 3, 8, 11, and 10; 72–96 h: n = 8, 6, 3, 3, 3, and 4; 168 h: n = 8, 6, 3, 3, and 4; Mann-Whitney or Kruskal-Wallis tests. Cas9 only and −DSB (RNP) were used as a group for statistical analysis. (E) Combined immunofluorescence staining for 53BP1 (green), DAPI (gray), and DNA FISH for IL2RG (red) in female HSPCs 12 h after treatment with ZFN or HS RNP. Arrowheads and asterisks show alleles associated or not with 53BP1, respectively. Scale bar represents 2 μm. (F) Percentage of 53BP1+ cells carrying 0, 1, or 2 IL2RG alleles associated with 53BP1 foci in 3 independent donors. On average, 100 nuclei were analyzed for each condition. Two-tail χ2 test; n.d., not detected. (G) Spearman correlation between percentage of 53BP1+ cells and NHEJ at IL2RG 12–24 h post-electroporation. (H) Fold expression of p21 relative to −DSB (ZFN) control at 12–24 h (12–24 h: n = 5, 6, 13, and 6; 72–96 h: n = 10 and 7; 168 h: n = 7 and 7). UT, untreated sample; UT electro, electroporation only. Mann-Whitney test. (I) Fold expression of p21 relative to −DSB(RNP) control. Cells were treated with Cas9 only or escalating doses of IL2RG HS or LS RNPs (12–24 h: n = 3, 4, 4, 4, 3, and 3; 72 h: n = 3, 4, 4, 3, 3, and 3). Kruskal-Wallis test on indicated groups is shown. Where indicated, conditions were used as a group for statistical analysis. (J) Number of live cells after electroporation of HSPCs treated as indicated (n = 6). Linear mixed-effects (LME) model followed by post hoc analysis at the last time point is shown. (K) Number of colonies plated at the indicated time post-editing (24 h: n = 8, 9, 6, 7, and 6; 72–96 h: n = 10, 9, 5, 6, and 5; 168 h: n = 10, 10, 5, 4, and 3). Mann-Whitney or Kruskal-Wallis tests. ns: p > 0.05; p < 0.05; ∗∗p < 0.01; ∗∗∗p < 0.001; ∗∗∗∗p < 0.0001. Lines indicate median values.
Figure 2
Figure 2
Transcriptional Impact of DNA DSBs in HSPCs at a Single-Cell Resolution (A) tSNE (t-distributed stochastic neighbor embedding) plot comprising scRNA-seq data from HSPCs 24 h after editing. Clusters and associated cell types are indicated by name and colors. (B) Heatmap showing expression (scaled log-transformed transcript per kilobase million [TPM] values) of selected genes associated with HSC and MPP state, myeloid, or erythroid lineages for each cluster. (C) Violin plots showing overall average expression (log transformed) of genes within each signature for each cluster. HSC and progenitor signatures are from Doulatov et al. (2013). (D and E) Stacked barplots showing distribution of the identified clusters (D) or HSC subclusters (E) across samples. (F) Stacked barplots showing the distribution of G1-S-G2/M cell cycle phase genes (Nestorowa et al., 2016) across the identified HSC subclusters. −DSB(RNP) sample is shown. (G and H) Violin plots showing the overall average expression (log-transformed TPM values) of HDR-related (G) and NHEJ-related (H) genes, in different cell clusters of −DSB(RNP) condition (R-hsa-5685942 and R-hsa03440 for HDR; KEGG: hsa03450 for NHEJ). (I) Heatmap showing NES values for GSEA performed for the indicated clusters. All samples were ranked by Log2FC value after comparison to −DSB(RNP) control; p-adjusted < 0.05. (J) Heatmap showing the mean of the sum of the expression level of genes directly upregulated by p53 (Fischer, 2017) or c-myc (Zeller et al., 2003) transcriptional activity within clusters. (K) Expression of IL-8 (n = 8, 4, 7, and 5), IL-6 (n = 5, 3, 5, and 5), TNF-α (n = 7, 3, 6, and 5), and IFN-1β (n = 8, 2, 8, and 5) measured by qRT-PCR 72 h post-treatment. Kruskal Wallis test; lines indicate median values. ns: p > 0.05; p < 0.05; ∗∗p < 0.01.
Figure 3
Figure 3
p53-Dependent Transcriptional Response Is Predominant upon AAVS1 and IL2RG Editing (A and B) Venn diagram of DEGs in ZFN AAVS1 or IL2RG versus −DSB in CD34+CD133+CD90+ (A) and CD34+CD133+CD90 (B) sorted HSPCs. (C) Heatmap of regularized log-normalized read counts for genes showing differential expression with adjusted p values < 0.05 across the indicated conditions in HSPC subpopulations; genes (listed in Data S1B) are sorted according to hierarchical clustering, and colors represent the read count values scaled per row (Z scores). (D) Heatmap showing NES from GSEA against the hallmark gene sets of the Molecular Signatures Database (MSigDB), starting from the list of genes ranked by Log2FC. Terms are sorted according to NES. (E and F) Volcano plot showing significant down- (green) and up- (red) regulated genes in primitive cells upon DSB at IL2RG (E) and AAVS1 (F) loci. DEGs in proximity of the targeted locus and top 10 p53 target genes ranked by false discovery rate (FDR) are indicated.
Figure 4
Figure 4
Impact of Targeted-Integration Procedure on HSPC Biology (A) Heatmap showing NES values for GSEA performed for the indicated clusters. All DEGs in samples were ranked by Log2FC value after comparison to −DSB(RNP) control. p-adjusted < 0.05. (B) Heatmap showing the mean of the sum of the expression of genes upregulated directly by p53 or c-myc or belonging to HLA class I (Halenius et al., 2015). (C) Volcano plots showing DEGs in the indicated samples compared to −DSB(RNP) control for “HSC-enriched 1” cluster. Green, downregulated genes; red, upregulated genes with log10 (p-adjusted) < 1.5. (D) Venn diagram showing the comparison among significant (Log10(p-adjusted) < 1.5) and upregulated (Log2FC > 0.2) genes. Top 5 significant GO terms (Log10(p-adjusted) < 2, Reactome database) enriched within the boxed set of genes are reported. (E) Volcano plots showing DEGs in HS/AAV6 GFP+ versus HS/AAV6 GFP− for “HSC-enriched 1” cluster. Color scale is as in (C). (F) Fold expression of p21 relative to electroporation control 24-h post-treatments (n = 11, 5, 6, 3, 3, 8, and 7). Kruskal-Wallis test; lines indicate median values. (G) 53BP1-positive cells at 12–20 h post-treatments (n = 8, 12, 5, and 4). Kruskal-Wallis test. (H and I) Percentage of target integration by HDR measured 72 h after IL2RG editing using the indicated donor templates in bulk (H; n = 6, 3, 3, and 6) or within the indicated HSPC subpopulations (I; n = 3). ns: p > 0.05; p < 0.05; ∗∗p < 0.01; ∗∗∗p < 0.001.
Figure 5
Figure 5
Dampening the p53 Transcriptional Signature Induced by Gene Editing Increases HSPC Proliferation without Detectable Impact on Genome Integrity (A) Fold expression of p53-target genes relative to untreated control at 24 h post-treatment (HS/AAV6: n = 8; HS/AAV6+GSE56: n = 7; −DSB(RNP): n = 3). Mann-Whitney test; lines indicate median values. (B) Cellular confluence after indicated treatments. Up to 50 independent measurements from 3–6 biological replicates were performed. LME model followed by post hoc analysis at the last time point is shown. (C) Percentage of HSPCs in indicated cell cycle phases measured at 24 h (n = 6, 6, 6, 6, and 6) and 96 h (n = 6, 6, 5, 6, and 6) post-treatments. Significance was calculated for each time point comparing treatments to −DSB(RNP), LME model for each cell cycle phase. (D) Representative karyotype analysis on HSPC metaphase spreads at 2–4 weeks post-treatments. 157 metaphases from 3 independent donors were analyzed. Percentage of NHEJ and HDR at AAVS1 is indicated. (E) Representative images of chromosome paint DNA FISH for chromosome 19 (red) and chromosome X (green) on metaphase spreads from HSPCs edited at AAVS1 in presence or not of GSE56. (F) Percentage of IL2RG alleles harboring chromosome X-14 translocation in HS-RNP-treated HSPCs 72 h post-electroporation (−/+GSE56: n = 10; UT: n = 4), in pools of outgrown colonies (−/+GSE56: n = 6), and in BM cells of mice from Figure 6E (−/+GSE56: n = 6); Wilcoxon matched-pairs signed rank test. (G) Circos plots for nucleotide substitutions and small indels in HSPCs edited in presence or not of GSE56 2 weeks post-treatment. No significant differences across conditions by two-way ANOVA. ns: p > 0.05; p < 0.05; ∗∗p < 0.01; ∗∗∗p < 0.001; ∗∗∗∗p < 0.0001.
Figure 6
Figure 6
Transient p53 Inhibition Increases the Clonogenic and In Vivo Repopulating Capacity of Edited HSPCs (A) Percentage of HDR and NHEJ 72 h post-editing with AAVS1 or IL2RG HS RNP in presence or not of GSE56 (n = 9); Wilcoxon matched-pairs signed rank test. (B) Percentage of GFP+ cells 72 h after AAVS1 or IL2RG gene editing in presence or not of GSE56 (n = 15); paired t test. (C) Colonies from sorted CD133+CD90+ or CD133+CD90 edited cells (n = 11); Mann-Whitney test. (D–F) Percentage of human CD45+ cells in the peripheral blood (PB) of NSG mice transplanted with (D) HSPCs treated with control mRNA or GSE56 or IL2RG ZFN+AAV6 cells with or without GSE56 (n = 4, 3, 4, and 4), (E) IL2RG HS RNP+AAV6 cells with or without GSE56 (n = 6 and 5), and (F) HSPCs edited as in (E) at AAVS1 site (n = 5 and 5); nonparametric longitudinal data analysis. (G–I) Percentage of GFP+ cells measured in PB of mice transplanted with cells from (D) in (G), from (E) in (H), and from (F) in (I), respectively. (J) Percentage of human CD45+GFP+ cells in hematopoietic organs of mice from (D)–(F) (HS/AAV6: n = 14; HS/AAV6+GSE56: n = 15); Mann-Whitney test. (K) Human PB engraftment after secondary transplant of CD34+ HSPCs sorted from BM of mice in (E) and (F) (n = 6 and 6). (L) Percentage of GFP+ cells measured within human graft of mice from (K). p < 0.05; ∗∗p < 0.01; ∗∗∗p < 0.001; ∗∗∗∗p < 0.0001. Lines indicate median values.

Comment in

References

    1. Beerman I., Seita J., Inlay M.A., Weissman I.L., Rossi D.J. Quiescent hematopoietic stem cells accumulate DNA damage during aging that is repaired upon entry into cell cycle. Cell Stem Cell. 2014;15:37–50. - PMC - PubMed
    1. Biechonski S., Olender L., Zipin-Roitman A., Yassin M., Aqaqe N., Marcu-Malina V., Rall-Scharpf M., Trottier M., Meyn M.S., Wiesmüller L. Attenuated DNA damage responses and increased apoptosis characterize human hematopoietic stem cells exposed to irradiation. Sci. Rep. 2018;8:6071. - PMC - PubMed
    1. Bothmer A., Phadke T., Barrera L.A., Margulies C.M., Lee C.S., Buquicchio F., Moss S., Abdulkerim H.S., Selleck W., Jayaram H. Characterization of the interplay between DNA repair and CRISPR/Cas9-induced DNA lesions at an endogenous locus. Nat. Commun. 2017;8:13905. - PMC - PubMed
    1. Brinkman E.K., Kousholt A.N., Harmsen T., Leemans C., Chen T., Jonkers J., van Steensel B. Easy quantification of template-directed CRISPR/Cas9 editing. Nucleic Acids Res. 2018;46:e58. - PMC - PubMed
    1. Butler A., Hoffman P., Smibert P., Papalexi E., Satija R. Integrating single-cell transcriptomic data across different conditions, technologies, and species. Nat. Biotechnol. 2018;36:411–420. - PMC - PubMed

Publication types

Substances