. 2019 Jun 4;29(6):1410-1421.e4.
doi: 10.1016/j.cmet.2019.02.015. Epub 2019 Mar 21.

Increased Serine Synthesis Provides an Advantage for Tumors Arising in Tissues Where Serine Levels Are Limiting

Affiliations

Increased Serine Synthesis Provides an Advantage for Tumors Arising in Tissues Where Serine Levels Are Limiting

Mark R Sullivan et al. Cell Metab. .

Abstract

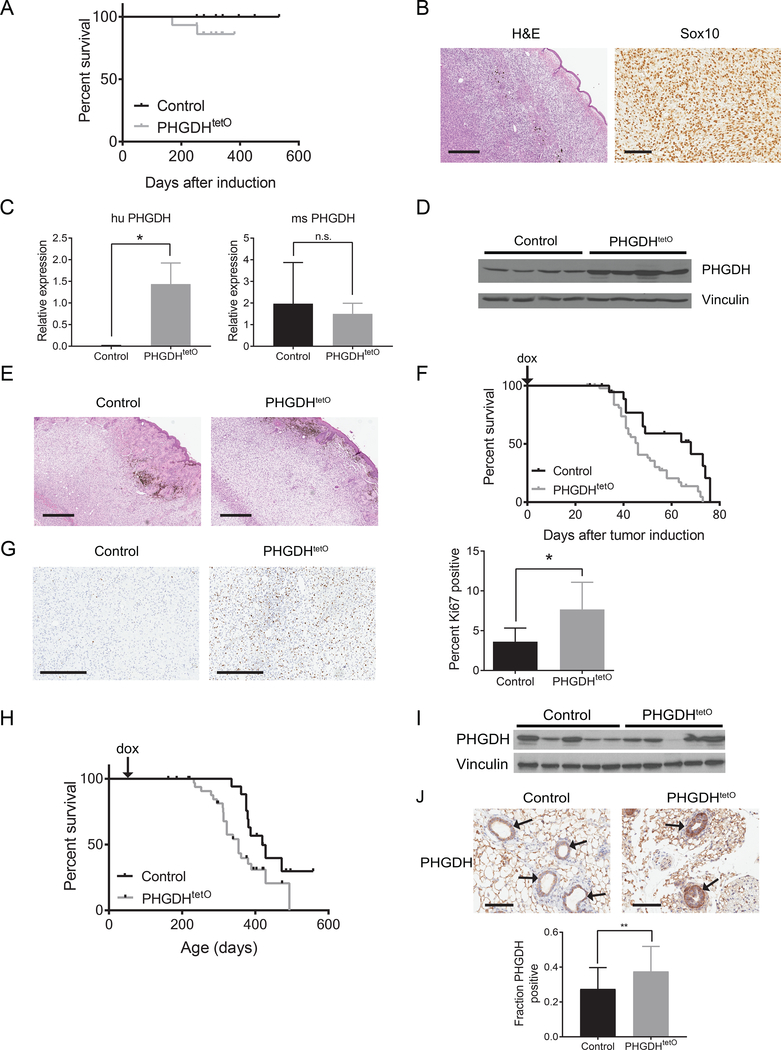
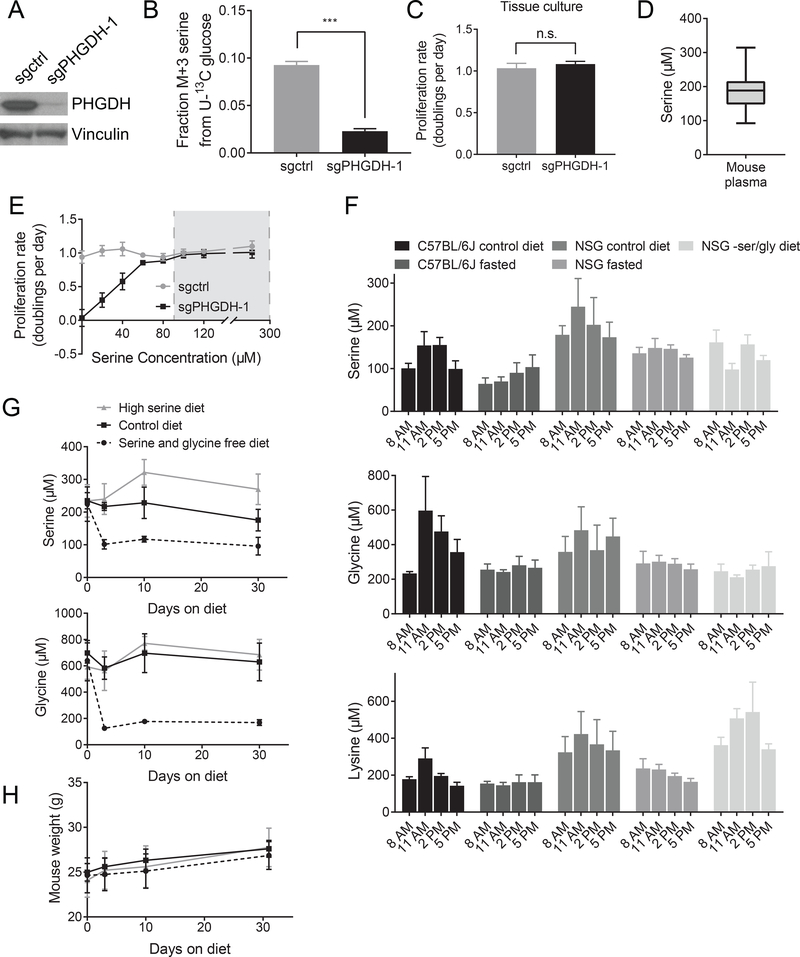
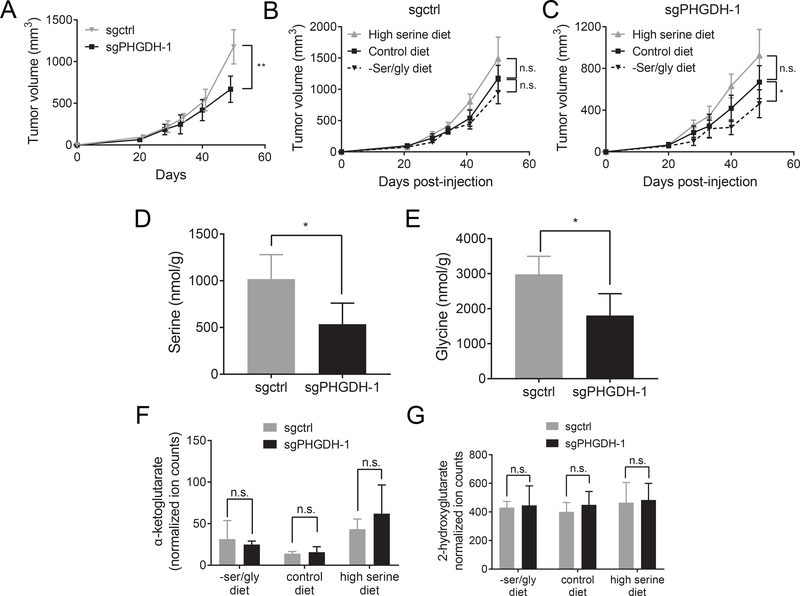
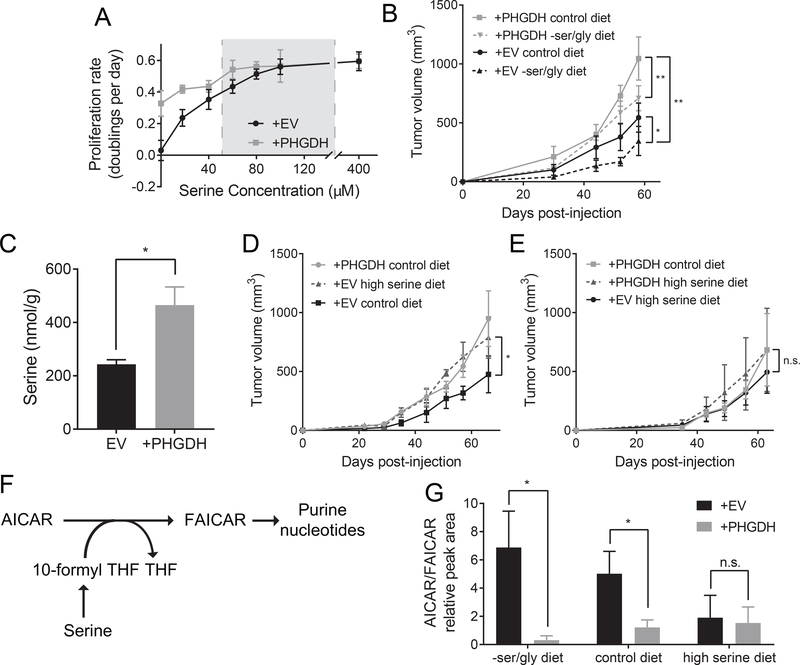
Tumors exhibit altered metabolism compared to normal tissues. Many cancers upregulate expression of serine synthesis pathway enzymes, and some tumors exhibit copy-number gain of the gene encoding the first enzyme in the pathway, phosphoglycerate dehydrogenase (PHGDH). However, whether increased serine synthesis promotes tumor growth and how serine synthesis benefits tumors is controversial. Here, we demonstrate that increased PHGDH expression promotes tumor progression in mouse models of melanoma and breast cancer, human tumor types that exhibit PHGDH copy-number gain. We measure circulating serine levels and find that PHGDH expression is necessary to support cell proliferation at lower physiological serine concentrations. Increased dietary serine or high PHGDH expression is sufficient to increase intracellular serine levels and support faster tumor growth. Together, these data suggest that physiological serine availability restrains tumor growth and argue that tumors arising in serine-limited environments acquire a fitness advantage by upregulating serine synthesis pathway enzymes.

Keywords: PHGDH; breast cancer; melanoma; serine.


Conflict of interest statement

DECLARATION OF INTERESTS

M.G.V.H. is on the scientific advisory board of Agios Pharmaceuticals, Aeglea Biotherapeutics, and Auron Therapeutics. The other authors declare no competing interests.

Figures

Figure 1.
Figure 1.. PHGDH expression promotes melanoma and breast cancer.
(A) Kaplan-Meier plot showing survival of control or PHGDH expressing (PHGDHtetO) mice with mutant Braf expression in melanocytes. N=14 for Control, N=15 for PHGDHtetO (B) Representative hematoxylin and eosin (H&E) and Sox10 immunohistochemistry staining of a tumor derived from a BrafCA; Tyr-CreER; PHGDHtetO; Rosa26-M2rtTA mouse. H&E image, 4x magnification, scale bar = 500 μm; Sox10 image, 20X magnification, scale bar = 100 μm. (C) Species specific RT-qPCR for human (huPHGDH) and mouse (msPHGDH) PHGDH in BrafCA Pten −/− melanomas from BrafCA; Ptenfl/fl; Tyr-CreER mice without (control) or with (PHGDHtetO) increased PHGDH expression as above. The difference in huPHGDH expression is significant (p = 0.0368) and the difference in msPHGDH expression is not significant (p = 0.7127) by unpaired, two-tailed Welch’s t tests. n=3 tumors for each genotype. (D) Western blot analysis of PHGDH expression in control or PHGDHtetO BrafCA Pten−/− tumors. (E) Representative H&E image of BrafCA; PTEN −/− tumors with normal (Control) or increased (PHGDHtetO) PHGDH expression. 4x magnification, scale bar = 500 μm. (F) Kaplan-Meier plot showing survival of control or PHGDH expressing (PHGDHtetO) mice bearing BrafCA; Pten −/− melanomas. Doxycycline (dox) diet started on the day of tumor induction (arrow). Difference in survival is significant (p = 0.012) by a stratified Cox proportional hazards model. n=13 for control mice, n=36 for PHGDHtetO mice (G) Representative immunohistochemistry assessing Ki67 in control and PHGDH expressing (PHGDHtetO) BrafCA; Pten−/− tumors. 10x magnification, scale bar = 300 μm. The difference in Ki67 staining was significant (p = 0.0358) by an unpaired, two-tailed Welch’s T test. (H) Kaplan-Meier plot showing survival of control or PHGDH expressing (PHGDHtetO) BRCAfl/fl; Trp53+/−; MMTV-Cre mice with breast tumors. Difference in survival is significant (p = 0.0269) by a Mantel-Cox log-rank test. n=10 for control mice and n=22 for PHGDHtetO mice. (I) Western blot analysis of PHGDH expression in control or PHGDHtetO breast tumors arising in BRCAfl/fl; Trp53+/−; MMTV-Cre mice. (J) Representative PHGDH immunohistochemistry staining of mammary glands from 7-week old MMTV-rtTA (Control) and PHGDHtetO/+; MMTV-rtTA (PHGDHtetO) mice fed a doxycycline diet for 1 week prior to harvesting mammary tissue. Arrows indicate mammary ducts. 20x magnification, scale bar = 100 μm. PHGDHtetO mice exhibited a significant increase in the fraction of cells with high PHGDH expression (p=0.0025) by an unpaired, two-tailed Welch’s t test. Mean +/− SD is shown for all panels.
Figure 2.
Figure 2.. Physiological serine concentrations approach a range that is limiting for cell proliferation in culture.
(A) Western blot showing CRISPRi-mediated knockdown of PHGDH expression in cells derived from an autochthonous breast tumor arising in a BRCAfl/fl; Trp53+/−; MMTV-Cre mouse. Cells with sgRNA targeting PHGDH (sgPHGDH-1) or a non-targeting sgRNA (sgctrl) are shown. (B) Fraction of 13C-labeled serine (fully labeled, M+3) in control (sgctrl) or PHGDH knockdown (sgPHGDH-1) cells cultured in U-13C glucose. The difference in the fraction of labeled serine between the cell types is significant (p< 0.0001) by an unpaired, Welch’s t test. (C) Proliferation rate of control (sgctrl) and PHGDH knockdown (sgPHGDH-1) cells. There is no significant change in proliferation rate by unpaired, two-tailed Welch’s t test (p = 0.2820). (D) Serine concentration in plasma of C57BL/6J mice collected at 11 AM. n=60 mice. (E) Proliferation rate of control (sgctrl) and PHGDH knockdown (sgPHGDH-1) breast cancer cells cultured in media containing the indicated amounts of serine. Grey box indicates the range of plasma serine concentrations measured in (D). (F) Plasma serine, glycine, and lysine concentrations measured in the indicated mouse strains fed ad lib on a control diet, fasted starting at 5 AM, or fed a serine and glycine free diet for one week prior to measurement. Plasma was collected at the specified times. n=5 mice on each diet. (G) Plasma serine and glycine concentrations in C57BL/6J mice fed a serine and glycine free diet, a control diet, or a high serine diet for the indicated time. Plasma was collected at 11 AM. n=5 mice on each diet. (H) Mouse weight for animals fed a serine and glycine free diet, a control diet, or a high serine diet for the indicated time. n=5 mice on each diet. Mean +/− SD is shown for all panels.
Figure 3.
Figure 3.. PHGDH expression overcomes serine limitation in tumors growing in the mammary fat pad.
(A) Breast cancer cells from a breast tumor arising in a BRCAfl/fl; Trp53+/−; MMTV-Cre mouse with either a non-targeting sgRNA (sgctrl) or an sgRNA targeting PHGDH (sgPHGDH-1) were injected into the mammary fat pad of female NSG mice fed a control diet. Tumor size over time is shown. Tumor size at the final time point is significantly different based on an unpaired, two-tailed Welch’s t test (p = 0.0027). n=5 tumors per genotype. (B)-(C) Breast cancer cells from a breast tumor arising in BRCAfl/fl; Trp53+/−; MMTV-Cre mice with either a non-targeting sgRNA (sgctrl) (B) or an sgRNA targeting PHGDH (sgPHGDH-1) (C) were injected into the mammary fat pad of female NSG mice fed the indicated diets. Mice were fed the indicated diets starting the day that the cells were injected, and tumor size over time is shown. n=5 tumors per genotype. In (B), by comparing all three diet conditions, there was no significant correlation between increased dietary serine and increased tumor volume by an ANOVA test for trend (p=0.0770). There was no significant difference in final tumor volume between mice fed –ser/gly, control, or high serine diets based on unpaired, two-tailed Welch’s t tests for –ser/gly versus control (p=0.0986) and for control versus high serine diet (p=0.1217). In (C), by comparing all three diet conditions, there was a significant correlation between increased dietary serine and increased tumor volume by an ANOVA test for trend (p = 0.0022). There was a significant difference in final tumor volume between mice fed –ser/gly and control diets based on an unpaired, two-tailed Welch’s t test (p=0.0559). (D) Serine amount in control tumors (sgctrl) compared to PHGDH knockdown tumors (sgPHGDH-1). sgctrl tumors display a significant increase in serine concentration based on an unpaired, two-tailed Welch’s t test (p=0.032). n=4 tumors per genotype. (E) Glycine amount in control tumors (sgctrl) compared to PHGDH knockdown tumors (sgPHGDH-1). sgctrl tumors display a significant increase in glycine concentration based on an unpaired, two-tailed Welch’s t test (p=0.0332). n=4 tumors per genotype (F) Amount of α-ketoglutarate in control (sgctrl) and PHGDH knockdown (sgPHGDH-1) mammary fat pad orthotopic tumors in mice fed either a –ser/gly diet, a control diet, or a high serine diet as measured by LC/MS. No significant change in α-ketoglutarate levels were detected between sgctrl and sgPHGDH-1 tumors as determined by unpaired, two-tailed Welch’s t tests (p=0.5917, 0.6834, and 0.2908, respectively). (G) Amount of 2-hydroxyglutarate in control (sgctrl) and PHGDH knockdown (sgPHGDH-1) mammary fat pad orthotopic tumors in mice fed either a –ser/gly diet, a control diet, or a high serine diet as measured by LC/MS. No significant change in 2-hydroxyglutarate levels were detected between sgctrl and sgPHGDH-1 tumors as determined by unpaired, two-tailed Welch’s t tests (p=0.8387, 0.4603, and 0.8368, respectively). n=4 tumors per genotype. Mean +/− SD is shown for all panels.
Figure 4.
Figure 4.. PHGDH expression provides serine to promote growth of human breast cancer xenografts.
(A) Proliferation rate of empty vector control (+EV) and PHGDH expressing (+PHGDH) MDA-MB-231 breast cancer cell lines cultured in media containing the indicated amounts of serine. Grey box indicates the reported range of plasma serine concentrations in humans (Trabado et al., 2017). (B) Empty vector control (+EV) or PHGDH expressing (+PHGDH) MDA-MB-231 breast cancer cells were injected into mammary fat pads of female NSG mice. Measurement of tumor size over time is shown for tumors derived from the indicated cells in mice fed the indicated diets starting the day that the cells were injected. There is a significant increase in tumor volume at the final time point between +PHGDH and +EV tumors in mice fed either a control diet or a –ser/gly diet based on unpaired, two-tailed Welch’s t tests (p=0.0055 and 0.0012, respectively). There is a significant difference in final tumor volume between +EV tumors in mice fed a control diet versus a –ser/gly diet based on an unpaired, two-tailed Welch’s t test (p=0.0510). n=5 mice for each combination of genotype and diet. (C) Serine concentration in empty vector control (EV) and PHGDH expressing (+PHGDH) MDA-MB-231 mammary fat pad orthotopic tumors. PHGDH expressing tumors displayed a significant increase in serine concentration as determined by an unpaired, two-tailed Welch’s t test (p=0.0437). n=5 tumors for each genotype. (D)-(E) Empty vector control (+EV) or PHGDH expressing (+PHGDH) MDA-MB-231 breast cancer cells were injected into mammary fat pads of female NSG mice. Measurement of tumor size over time is shown for tumors derived from the indicated cells in mice fed the indicated diets starting the day that the cells were injected. There is a significant increase in tumor volume at the final time point between +EV tumors in mice fed either a control diet or a high serine diet based on an unpaired, two-tailed Welch’s t test (p=0.0268). There is no significant difference in tumor volume at the final time point between +PHGDH control diet and +PHGDH high serine diet or between +EV high serine diet and +PHGDH high serine diet based on unpaired, two-tailed Welch’s t tests (p=0.9977 and 0.3277, respectively). n=5 mice for each combination of genotype and diet. (F) Schematic with select intermediates in de novo purine nucleotide biosynthesis. THF: tetrahydrofolate. AICAR: 5-aminoimidazole-4-carboxamide ribonucleotide. FAICAR: 5-formamidoimidazole-4-carboxamide ribonucleotide. (G) Ratio of total ion counts of AICAR to FAICAR by LC/MS in empty vector control (EV) and PHGDH expressing (+PHGDH) MDA-MB-231 mammary fat pad orthotopic tumors in mice fed either a diet lacking serine and glycine (-ser/gly), a control diet, or a high serine diet. PHGDH expressing tumors in mice fed a diet lacking serine and glycine and in mice fed a control diet showed a significant decrease in relative AICAR/FAICAR ratio relative to control tumors as determined by an unpaired, two-tailed Welch’s t test (p=0.0350 and 0.0419, respectively). There was no significant difference between the relative AICAR/FAICAR ratios in PHGDH expressing and control tumors derived from mice fed a high serine diet by an unpaired, two-tailed Welch’s t test (p=0.859). n=4 tumors per genotype. Mean +/− SD is shown for all panels.

References

    1. Adams CM (2007). Role of the transcription factor ATF4 in the anabolic actions of insulin and the anti-anabolic actions of glucocorticoids. J Biol Chem 282, 16744–16753. - PubMed
    1. Aird KM, Zhang G, Li H, Tu Z, Bitler BG, Garipov A, Wu H, Wei Z, Wagner SN, Herlyn M, et al. (2013). Suppression of nucleotide metabolism underlies the establishment and maintenance of oncogene-induced senescence. Cell Rep 3, 1252–1265. - PMC - PubMed
    1. Anlinker J, and Mayer J (1956). An Operant Conditioning Technique for Studying Feeding-Fasting Patterns in Normal and Obese Mice. Journal of Applied Physiology 8, 667–670. - PubMed
    1. Bao XR, Ong SE, Goldberger O, Peng J, Sharma R, Thompson DA, Vafai SB, Cox AG, Marutani E, Ichinose F, et al. (2016). Mitochondrial dysfunction remodels onecarbon metabolism in human cells. Elife 5. - PMC - PubMed
    1. Ben-Sahra I, Hoxhaj G, Ricoult SJH, Asara JM, and Manning BD (2016). mTORC1 induces purine synthesis through control of the mitochondrial tetrahydrofolate cycle. Science 351, 728–733. - PMC - PubMed

Publication types

Substances