

Diagnosing osteoarthritis from T2 maps using deep learning: an analysis of the entire Osteoarthritis Initiative baseline cohort
- PMID: 30905742
- PMCID: PMC6579664
- DOI: 10.1016/j.joca.2019.02.800
Diagnosing osteoarthritis from T2 maps using deep learning: an analysis of the entire Osteoarthritis Initiative baseline cohort
Abstract
Objective: We aim to study to what extent conventional and deep-learning-based T2 relaxometry patterns are able to distinguish between knees with and without radiographic osteoarthritis (OA).
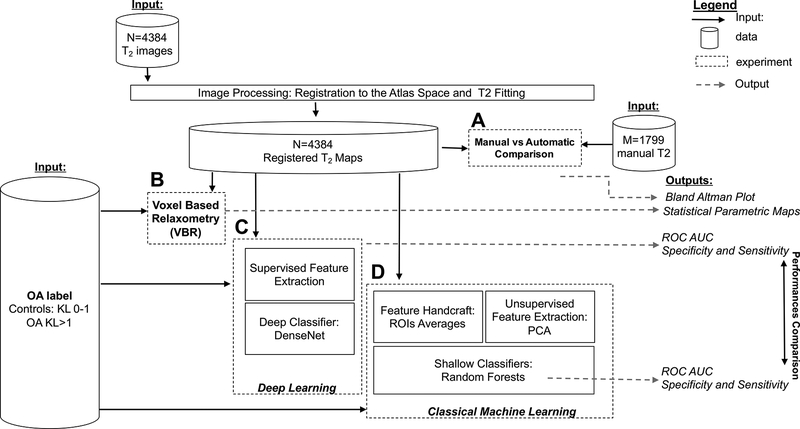
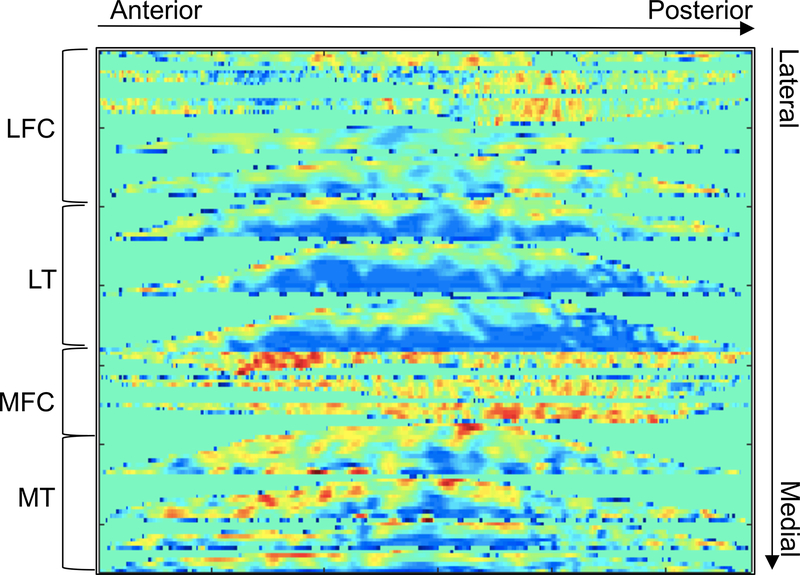
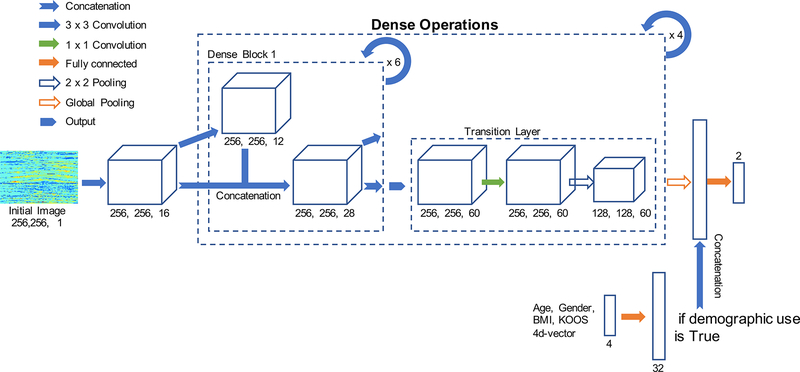
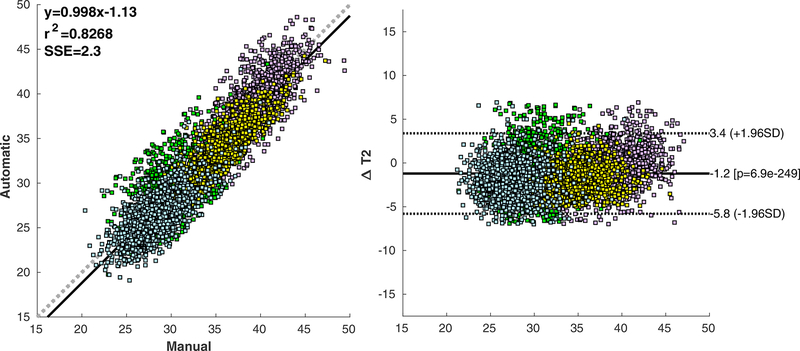
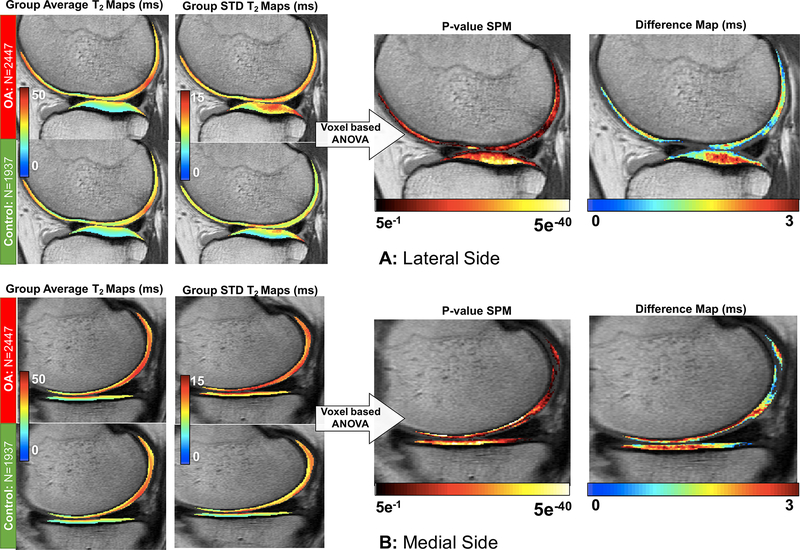
Methods: T2 relaxation time maps were analyzed for 4,384 subjects from the baseline Osteoarthritis Initiative (OAI) Dataset. Voxel Based Relaxometry (VBR) was used for automatic quantification and voxel-based analysis of the differences in T2 between subjects with and without radiographic OA. A Densely Connected Convolutional Neural Network (DenseNet) was trained to diagnose OA from T2 data. For comparison, more classical feature extraction techniques and shallow classifiers were used to benchmark the performance of our algorithm's results. Deep and shallow models were evaluated with and without the inclusion of risk factors. Sensitivity and Specificity values and McNemar test were used to compare the performance of the different classifiers.
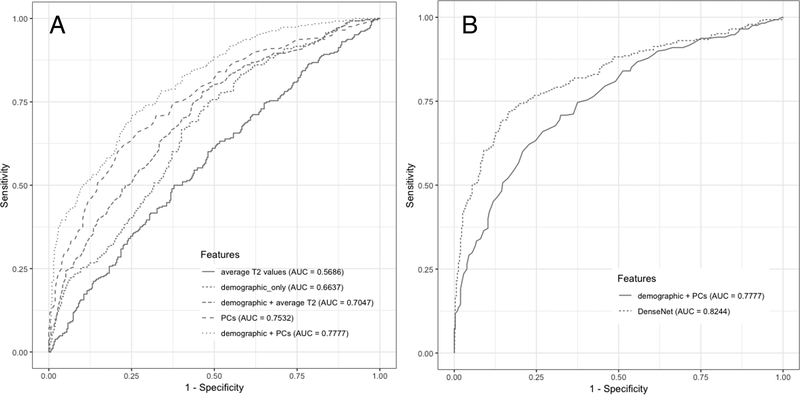
Results: The best shallow model was obtained when the first ten Principal Components, demographics and pain score were included as features (AUC = 77.77%, Sensitivity = 67.01%, Specificity = 71.79%). In comparison, DenseNet trained on raw T2 data obtained AUC = 83.44%, Sensitivity = 76.99%, Specificity = 77.94%. McNemar test on two misclassified proportions form the shallow and deep model showed that the boost in performance was statistically significant (McNemar's chi-squared = 10.33, degree of freedom (DF) = 1, P-value = 0.0013).
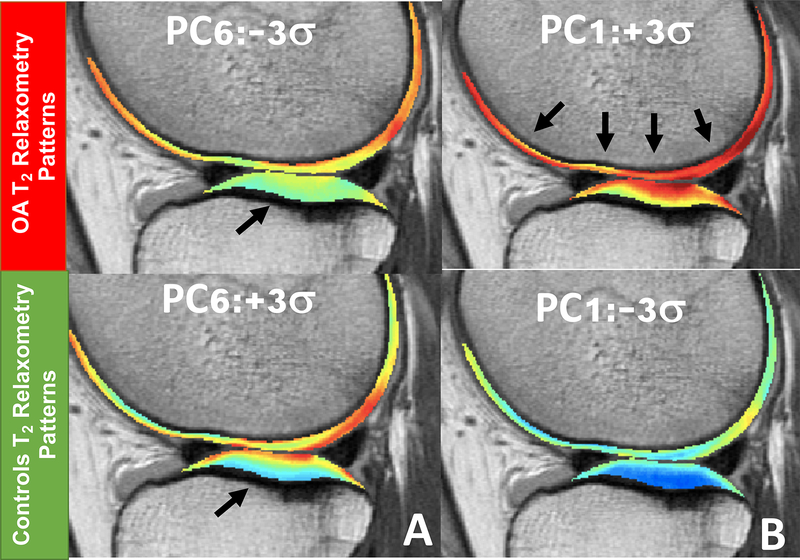
Conclusion: In this study, we presented a Magnetic Resonance Imaging (MRI)-based data-driven platform using T2 measurements to characterize radiographic OA. Our results showed that feature learning from T2 maps has potential in uncovering information that can potentially better diagnose OA than simple averages or linear patterns decomposition.
Keywords: Convolutional neural network; Deep learning; Quantitative MRI; T(2) relaxation times; Voxel based relaxometry.
Copyright © 2019 Osteoarthritis Research Society International. Published by Elsevier Ltd. All rights reserved.
Conflict of interest statement
CONFLICTS OF INTEREST
The authors have no conflict of interests to disclose
Figures
References
-
- Centers for Disease Control and Prevention: Osteoarthritis. 2017.
-
- Felson DT, Lawrence RC, Hochberg MC, McAlindon T, Dieppe PA, Minor MA, et al. Osteoarthritis: new insights. Part 2: treatment approaches. Ann Intern Med 2000; 133: 726–737. - PubMed
-
- Link TM, Neumann J, Li X. Prestructural cartilage assessment using MRI. J Magn Reson Imaging 2017; 45: 949–965. - PubMed
Publication types
MeSH terms
Grants and funding
LinkOut - more resources
Full Text Sources
Medical
Miscellaneous
