. 2018 Nov 2:7:1740.
doi: 10.12688/f1000research.16613.2. eCollection 2018.

False signals induced by single-cell imputation

Affiliations

False signals induced by single-cell imputation

Tallulah S Andrews et al. F1000Res. .

Abstract

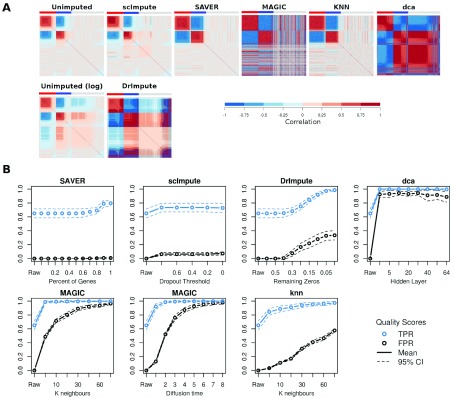
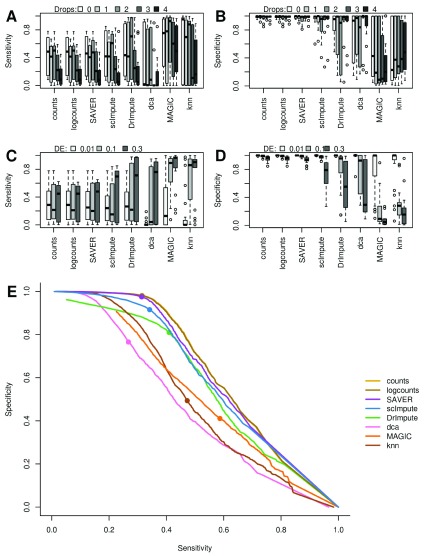
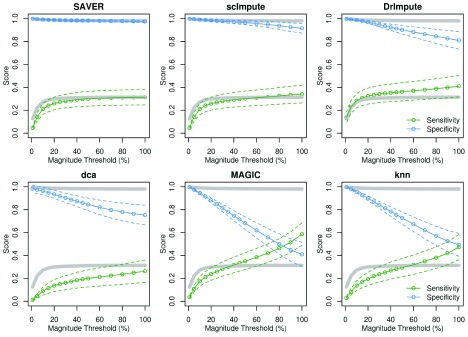
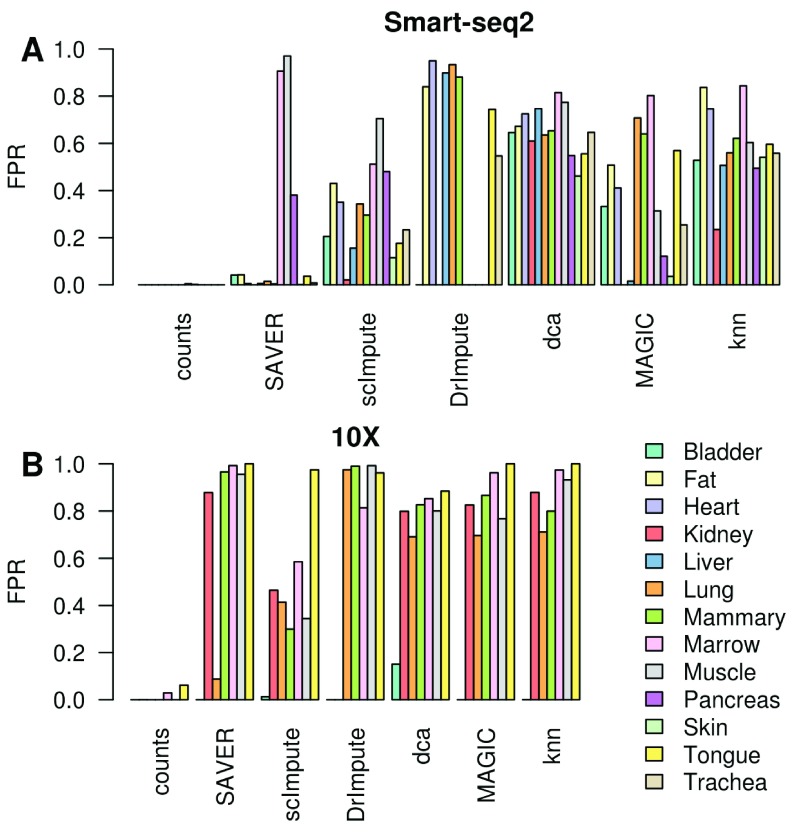
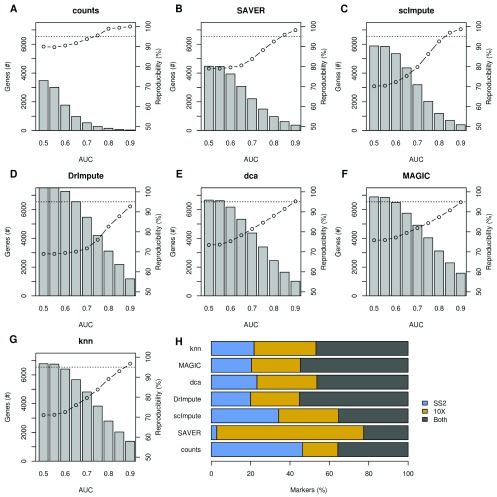
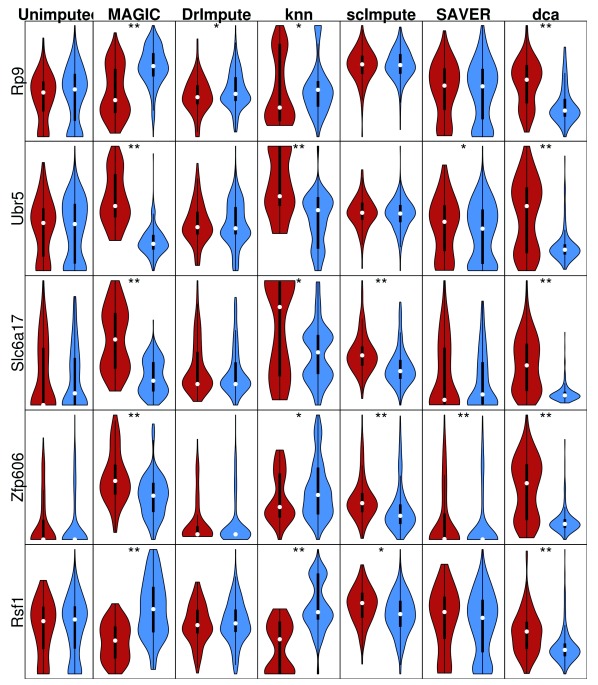
Background: Single-cell RNA-seq is a powerful tool for measuring gene expression at the resolution of individual cells. A challenge in the analysis of this data is the large amount of zero values, representing either missing data or no expression. Several imputation approaches have been proposed to address this issue, but they generally rely on structure inherent to the dataset under consideration they may not provide any additional information, hence, are limited by the information contained therein and the validity of their assumptions. Methods: We evaluated the risk of generating false positive or irreproducible differential expression when imputing data with six different methods. We applied each method to a variety of simulated datasets as well as to permuted real single-cell RNA-seq datasets and consider the number of false positive gene-gene correlations and differentially expressed genes. Using matched 10X and Smart-seq2 data we examined whether cell-type specific markers were reproducible across datasets derived from the same tissue before and after imputation. Results: The extent of false-positives introduced by imputation varied considerably by method. Data smoothing based methods, MAGIC, knn-smooth and dca, generated many false-positives in both real and simulated data. Model-based imputation methods typically generated fewer false-positives but this varied greatly depending on the diversity of cell-types in the sample. All imputation methods decreased the reproducibility of cell-type specific markers, although this could be mitigated by selecting markers with large effect size and significance. Conclusions: Imputation of single-cell RNA-seq data introduces circularity that can generate false-positive results. Thus, statistical tests applied to imputed data should be treated with care. Additional filtering by effect size can reduce but not fully eliminate these effects. Of the methods we considered, SAVER was the least likely to generate false or irreproducible results, thus should be favoured over alternatives if imputation is necessary.

Keywords: Gene expression; Imputation; RNA-seq; Reproducibility; Type 1 errors; single-cell.


Conflict of interest statement

No competing interests were disclosed.

Figures

Figure 1.
Figure 1.. False gene-gene correlations induced by single-cell imputation methods.
( A) Gene-gene correlations before and after imputation using suggested parameter values: SAVER (all genes), MAGIC ( k=12, t=3), knn ( k=50), scImpute (threshold=0.5), DrImpute (remaining zeros=0), dca (hidden layer size=32). Coloured bars indicate genes highly expressed (red) or lowly expressed (blue) in one cell population vs the other, or genes not differentially expressed between the populations (grey). Genes are ordered left to right by DE direction then by expression level (high to low). ( B) False positive and true positive gene-gene correlations (p < 0.05 Bonferroni multiple testing correction) as imputation parameters are changed. “Raw” indicates results for unimputed data. Dashed lines are 95% CIs based on 10 replicates.
Figure 2.
Figure 2.. Accuracy of detecting differentially expressed (DE) genes in splatter simulations before and after imputation with each method.
( A & B) Zero inflation decreases sensitivity of DE which most imputation methods fail to correct. ( C & D) Strong true signals (high proportion of DE genes) decreases specificity particularly for data-smoothing methods. ( E) Average ROC curves across all simulations, solid dots indicate 5% FDR. Counts were normalized by total library size prior to testing DE, and “logcounts” are log2(normalized counts+1).
Figure 3.
Figure 3.. Filtering by the magnitude of expression differences restores specificity in imputed data.
Sensitivity (green) and specificity (blue) of each imputation method applied to the splatter-simulated data, when restricting to only the top X% of genes by fold-change. Dashed lines indicate 95% CI. Grey lines indicate results for the un-imputed data.
Figure 4.
Figure 4.. High variability in false positives induced by imputation across datasets regardless of sequencing technology.
( A) Smart-seq2 datasets, ( B) 10X Chromium datasets. Non-differentially expressed genes were permuted prior to imputation.
Figure 5.
Figure 5.. Reproducibility of marker genes can be restored in imputed data using a strict effect-size threshold.
( AG) Markers were identified in 10X Chromium and Smart-seq2 data for six different mouse tissues. The average number of markers (bars, left axis) and proportion reproducible across both datasets (line, right axis) are plotted. Only significant markers (5% FDR) exceeding the AUC threshold were considered. ( H) Proportion of markers that were unique to the Smart-seq2 (blue, SS2), or 10X Chromium (yellow), or both (dark grey).
Figure 6.
Figure 6.. Examples of false positive DE induced by imputation of Pancreas Smart-seq2 data.
Unimputed indicates the permuted normalized log-transformed expression. Red = PP cell, Blue = A cell. * = p < 0.05, ** = significant after Bonferroni (q < 0.05) correction.

Similar articles

Cited by

References

    1. Benjamini Y, Hochberg Y: Controlling the false discovery rate: A practical and powerful approach to multiple testing. J Roy Stat Soc B Met. 1995;57(1):289–300. 10.1111/j.2517-6161.1995.tb02031.x - DOI
    1. Bullard JH, Purdom E, Hansen KD, et al. : Evaluation of statistical methods for normalization and differential expression in mRNA-Seq experiments. BMC Bioinformatics. 2010;11:94. 10.1186/1471-2105-11-94 - DOI - PMC - PubMed
    1. Chou WC, Zheng HF, Cheng CH, et al. : A combined reference panel from the 1000 Genomes and UK10K projects improved rare variant imputation in European and Chinese samples. Sci Rep. 2016;6:39313. 10.1038/srep39313 - DOI - PMC - PubMed
    1. Consortium, The Tabula Muris: Single-cell RNA-seq data from Smart-seq2 sequencing of FACS sorted cells. figshare.Fileset.2017a. 10.6084/m9.figshare.5715040.v1 - DOI
    1. Consortium, The Tabula Muris: Single-cell RNA-seq data from Smart-seq2 sequencing of FACS sorted cells. figshare.Fileset.2017b. 10.6084/m9.figshare.5715040.v1 - DOI

Publication types

LinkOut - more resources