. 2019 Mar;10(3):156-164.
doi: 10.3892/br.2019.1189. Epub 2019 Feb 4.

Changes in serum LDL, PCSK9 and microRNA-122 in patients with chronic HCV infection receiving Daclatasvir/Asunaprevir

Affiliations

Changes in serum LDL, PCSK9 and microRNA-122 in patients with chronic HCV infection receiving Daclatasvir/Asunaprevir

Tatsuki Ichikawa et al. Biomed Rep. 2019 Mar.

Abstract

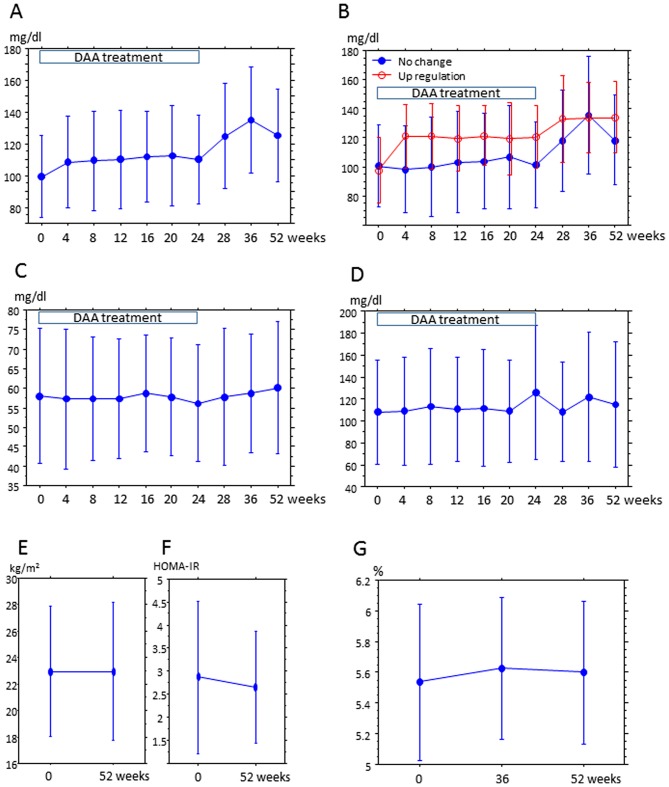
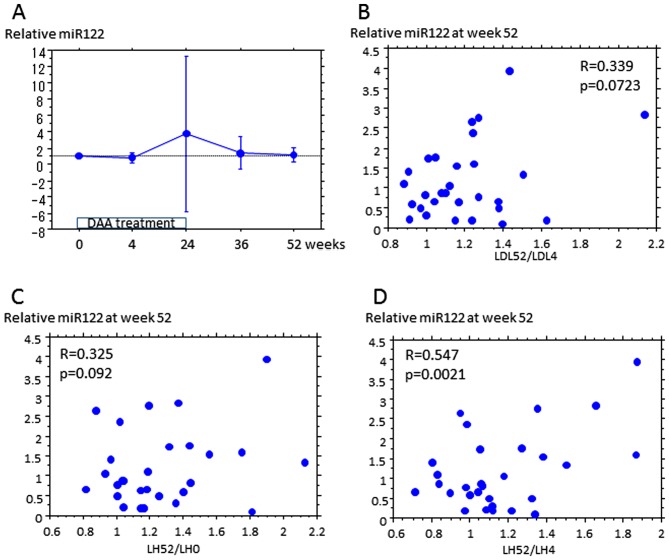
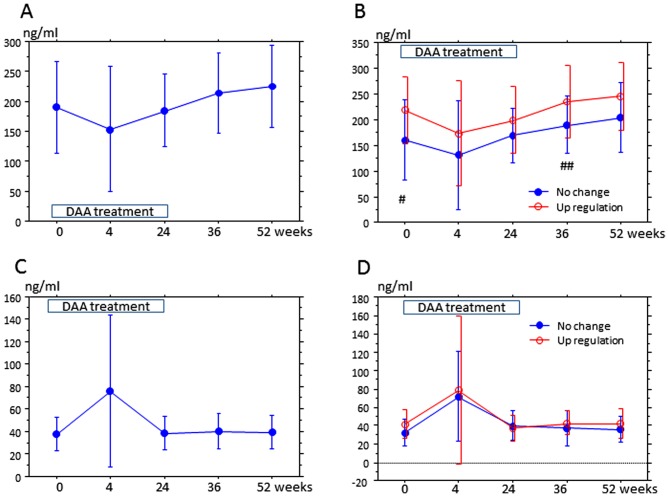
The present study evaluated the changes in lipid profile, and the associations between serum protein convertase subtilisin/kexin 9 (PCSK9), microRNA (miR)122 and low-density lipoprotein variation following treatment of hepatitis C virus (HCV) genotype 1b infection with Daclatasvir/Asunaprevir. A total of 39 patients with HCV genotype 1b infection with chronic hepatitis received a 24-week treatment regimen of Daclatasvir/Asunaprevir. Laboratory data were obtained for each subject every 4 weeks during treatment and every 12 weeks after treatment. Serum miR122 and PCSK9 were measured at the start of treatment (week 0), end of treatment (week 24), 4 weeks after the end of treatment (week 28), 12 weeks after the end of treatment (week 36) and 28 weeks after the end of treatment (week 52). LDL was increased at week 4 after the start of treatment to week 52. The increased LDL/HDL ratio at week 52 compared with week 4 was also associated with relative miR122 at week 52. At week 4, PCSK9-active form (A) was lower than that at other time points, and PCSK9-inactive form (I) exhibited the greatest increase. At week 52, PCSK9-A was higher than that during treatment, but PCSK9-I level at week 52 did not markedly differ from that any time point except for week 4. Relative miR122 at week 4 was associated with increased PCSK9-A at weeks 36 and 52 from the start of DAA. In summary, treatment of HCV with Daclatasvir/Asunaprevir resulted in elevated LDL, and relative miR122 and PCSK9-A levels in serum appeared to have some association with LDL increase.

Keywords: direct acting anti-virals; hepatitis C virus; low-density lipoprotein; microRNA122; protein convertase subtilisin/kexin 9.


Figures

Figure 1.
Figure 1.
Changes in serum lipids from the start of DAA treatment to 52 weeks after treatment. DAA treatment was terminated after 24 weeks. LDL measurements at weeks 28, 36 and 52 were at weeks 4, 12, and 24 after the end of treatment, respectively. The y-axis is the mean LDL (A and B), HDL (C) and TG (D) concentration (mg/dl), and the x-axis is the time after the start of treatment. Error bars represent the standard deviation. Differences between time points (0 and other time points) were evaluated by a paired t-test, and difference among 0, 36 and 52 was evaluated by analysis of variance and P<0.05 were considered statistically significant. (A) Trend of LDL concentration in all patients. LDL at the start of treatment (week 0) was significantly lower than that at the other time points (week 4-52) (week 4, P=0.0011, week 8, P=0.0032; week 12, P=0.0027; week 16, P=0.0095; week 20, P=0.0037; week 24, P=0.0027 and weeks 28-52, P<0.0001). LDL at weeks 4, 8, 12, 16, 20 and 24 after treatment was significantly lower than LDL after the end of treatment (weeks 28, 36 and 52; week 4 vs. 28, P=0.0004; week 4 vs. 36-52, P<0.0001; week 8 vs. 28, P=0.0007; week 8 vs. 36-53, P<0.0001; week 12 vs. 28, P=0.0006, week 12 vs. week 36-53, P=0.0001; week 16 vs. week 28, P<0.0001; week 16 vs. week 36, P=0.0001; week 16 vs. week 52, P=0.0004; week 20 vs. 28-36; P<0.0001; week 20 vs. week 52, P=0.0008; week 24 vs. 28-36, P<0.0001; week 24 vs. 52, P=0.0002). LDL at week 36 after treatment was higher than LDL at week 52 (P=0.0464). (B) Trends of LDL concentration in the ‘no change’ and ‘upregulation’ groups. In the upregulation group: LDL at week 0 was lower than that at all other time points (weeks 4, 8, 16, 28, 36 and 52, P<0.0001; week 12, P=0.0003; week 20 and 24, P=0.0002); LDL at week 4 was lower than that at weeks 28 (P=0.0454) and 52 (P=0.0373); and LDL at weeks 8, 12, 16, 20 and 24 was lower than that after the end of treatment (weeks 28, 36, and 52; week 8 vs. 28, P=0.0291, week 8 vs. 36, P=0.0149; week 8 vs. 52, P=0.0134, week 12 vs. 28, P=0.0291, week 12 vs. 36, P=0.0149; week 12 vs. 52, P=0.0061, week 16 vs. 28, P=0.0212; week 16 vs. 36, P=0.0162; week 16 vs. 52, P=0.0170, week 20 vs. 28, P=0.0010, week 20 vs. 36, P=0.0396; week 20 vs. 52, P=0.0338; week 24 vs. 28, P=0.0013; week 24 vs. 36, P=0.0111, week 24 vs. 52, P=0.0308). In the no change group: LDL at week 0 was lower than that at weeks 28-52 (week 28, P=0.0067; week 36, P=0.0001 and week 52, P<0.0001); LDL at weeks 4-24 was lower than that at weeks 28, 36 and 52 (week 4 vs. 28, P=0.0030, week 4 vs. 36, P=0.0002, week 4 vs. 52, P<0.0001; week 8 vs. 24, P=0.0117, week 8 vs. 36, P=0.0002, week 8 vs. 52, P<0.0001, week 12 vs. 28, P=0.0006; week 12 vs. 36, P=0.0016; week 12 vs. 52, P=0.0018; week 16 vs. 28, P=0.0005; week 16 vs. 36, P=0.0019, week 16 vs. 52, P=0.0065; week 20 vs. 28, P=0.0033, week 20 vs. 36, P=0.0006; week 20 vs. 52, P=0.0132; week 24 vs. 28, P=0.0018; week 24 vs. 36, P=0.0012; week 24 vs. 52; P=0.0031); and LDL at week 36 was lower than that at week 52 (P=0.0279). (C) Trends of HDL concentration in all patients. No significant differences were identified at any time points. (D) Trends of TG concentration in all patients. No significant differences were identified at any time points. (E) BMI and (F) HOMA-IR were compared at weeks 0 and 52. No significant differences were identified at any time points. (G) Hemoglobin A1c was compared at weeks 0, 36 and 52. No significant differences were identified at any time points. DAA, direct acting anti-virals; HDL, high-density lipoprotein; LDL, low-density lipoprotein; TG, triglyceride; BMI, body mass index; HOMA-IR, homeostasis model assessment of insulin resistance; HbA1c, hemoglobin A1c.
Figure 2.
Figure 2.
Relative serum miR122 is marginally associated with an increase in LDL. The serum miR122 in 30 of the 39 patients was examined at weeks 0, 4, 24, 36 and 52. (A) Relative miR122 at each point fluctuated during the observation period but the differences were not significant. (B) Relative miR122 at week 52 had a positive but non-significant correlation with increased LDL at weeks 4-52. Rate of increase (y-axis) was calculated by the following ratio: LDL at week 52/LDL at week 4. (C and D) Relative miR122 at week 52 had some positive correlation with an increase in LDL/HDL (LH) rate at weeks (C) 0-52 and (D) 4-52. LH rate was calculated by the following ratio: LDL/HDL at the indicated time. miR122, microRNA122; LDL, low-density lipoprotein; HDL, high-density lipoprotein; DAA, direct acting anti-virals.
Figure 3.
Figure 3.
Serum PCSK9 is associated with upregulation of LDL at 52 weeks after treatment. Serum PCSK9 was examined in 30 of 39 patients at 0, 4, 24, 36 and 52 weeks. The y-axis is the mean PCSK9 concentration (ng/ml), and the x-axis is the time after the start of treatment. Error bars represent the standard deviation. (A and B) The trends of PCSK9-A; (C and D) the trends of PCSK9-I. (A) Compared with other time points, PCSK9-A at week 4 was significantly lower (week 0, P=0.0492; week 24, P=0.046; week 36, P=0.046 and week 52, P=0.0111). PCSK9-A at week 52 was higher than that at weeks 0 (P=0.0184), 4 (P=0.0009) and 24 (P=0.0038); these differences were also statistically significant. (B) In the upregulation group, PCSK9-A at week 4 was lower than that at week 0 (P=0.0725), week 36 (P=0.046), and week 52 (P=0.0111); additionally, PCSK9-A at week 24 was lower than that at weeks 36 (P=0.0488) and 52 (P=0.0457). In the no change group, PCSK9-A at week 52 was higher than that at weeks 0 (P=0.0725), 4 (P=0.0399) and 24 (P=0.0457). PCSK9-A at week 0 in the upregulation group was higher than that in the no change group (#P=0.0413), and PCSK9-A at week 36 in the upregulation group was higher than that in the no change group (##P=0.0697). (C) PCSK9-I at week 4 was higher than that at weeks 0 (P=0.0055), 24 (P=0.0073) and 36 (P=0.0099); these values were statistically significant. (D) In the upregulation group, PCSK9-I at week 4 was higher than that at weeks 0 (P=0.09), 24 (P=0.0568) and 52 (P=0.0962). In the no change group, PCSK9-I at week 4 was higher than that at weeks 0 (P=0.0159), 24 (P=0.0557), 36 (P=0.031) and 52 (P=0.0962). At each time point, PCSK9-I was not significantly altered between the no change and upregulation groups. PCSK9-A/I, protein convertase subtilisin/kexin 9-active/inactive; LDL, low-density lipoprotein. DAA, direct acting anti-virals.

Similar articles

Cited by

References

    1. Negro F. Abnormalities of lipid metabolism in hepatitis C virus infection. Gut. 2010;59:1279–1287. doi: 10.1136/gut.2009.192732. - DOI - PubMed
    1. Cacoub P, Comarmond C, Domont F, Savey L, Desbois AC, Saadoun D. Extrahepatic manifestations of chronic hepatitis C virus infection. Ther Adv Infect Dis. 2016;3:3–14. doi: 10.1177/2049936115585942. - DOI - PMC - PubMed
    1. Ferri C, Sebastiani M, Giuggioli D, Colaci M, Fallahi P, Piluso A, Antonelli A, Zignego AL. Hepatitis C virus syndrome: A constellation of organ- and non-organ specific autoimmune disorders, B-cell non-Hodgkin's lymphoma, and cancer. World J Hepatol. 2015;7:327–343. doi: 10.4254/wjh.v7.i3.327. - DOI - PMC - PubMed
    1. Syed GH, Amako Y, Siddiqui A. Hepatitis C virus hijacks host lipid metabolism. Trends Endocrinol Metab. 2010;21:33–40. doi: 10.1016/j.tem.2009.07.005. - DOI - PMC - PubMed
    1. Chayama K, Takahashi S, Toyota J, Karino Y, Ikeda K, Ishikawa H, Watanabe H, McPhee F, Hughes E, Kumada H. Dual therapy with the nonstructural protein 5A inhibitor, daclatasvir, and the nonstructural protein 3 protease inhibitor, asunaprevir, in hepatitis C virus genotype 1b-infected null responders. Hepatology. 2012;55:742–748. doi: 10.1002/hep.24724. - DOI - PubMed