. 2018 Mar;4(1):015002.
doi: 10.1088/2057-1739/aaa013. Epub 2018 Jan 16.

Multiplex protein detection on circulating tumor cells from liquid biopsies using imaging mass cytometry

Affiliations

Multiplex protein detection on circulating tumor cells from liquid biopsies using imaging mass cytometry

Erik Gerdtsson et al. Converg Sci Phys Oncol. 2018 Mar.

Abstract

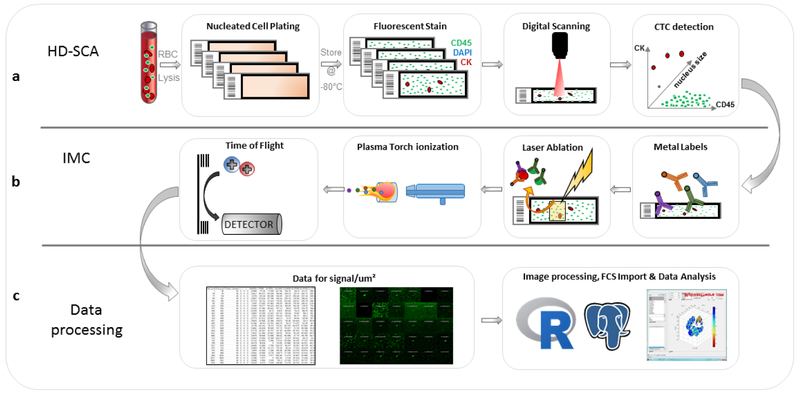
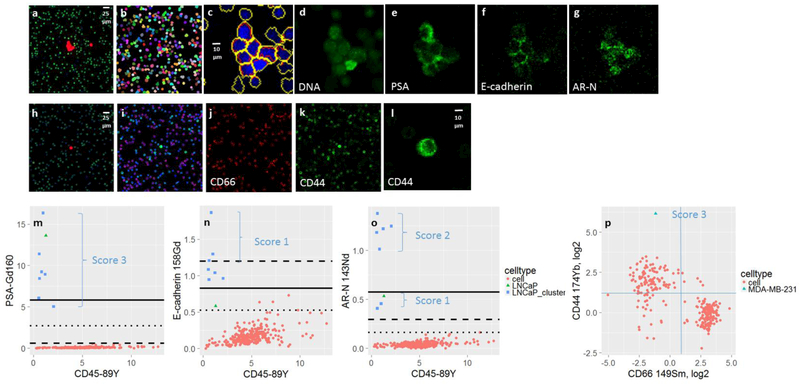
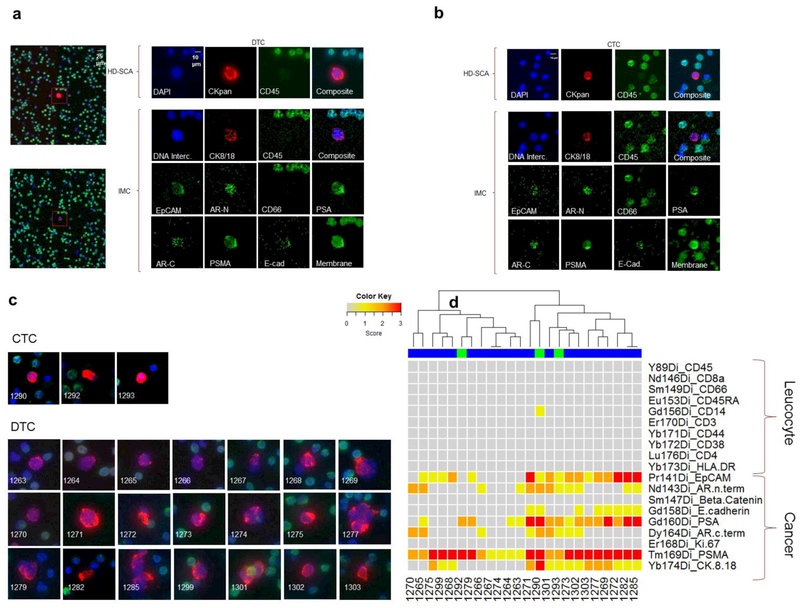
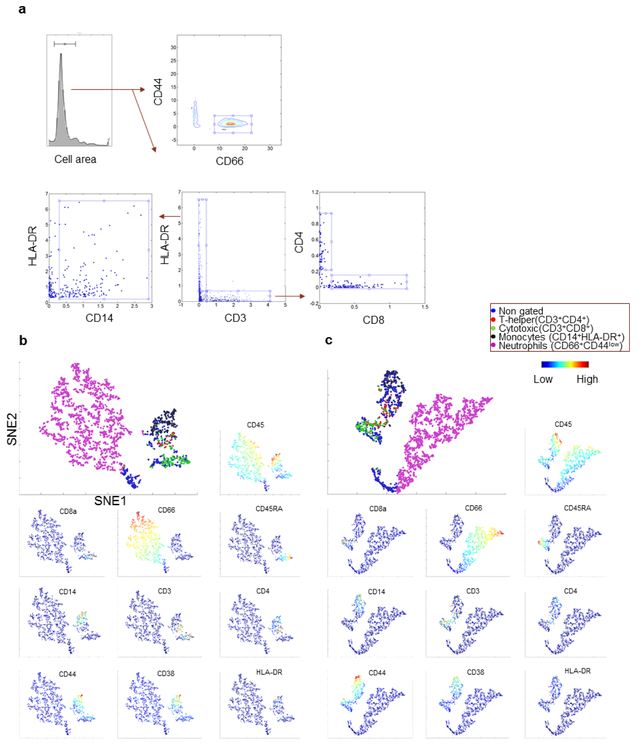
Molecular analysis of circulating and disseminated tumor cells (CTCs/DTCs) has great potential as a means for continuous evaluation of prognosis and treatment efficacy in near-real time through minimally invasive liquid biopsies. To realize this potential, however, methods for molecular analysis of these rare cells must be developed and validated. Here, we describe the integration of imaging mass cytometry (IMC) using metal-labeled antibodies as implemented on the Fluidigm Hyperion Imaging System into the workflow of the previously established High Definition Single Cell Analysis (HD-SCA) assay for liquid biopsies, along with methods for image analysis and signal normalization. Using liquid biopsies from a metastatic prostate cancer case, we demonstrate that IMC can extend the reach of CTC characterization to include dozens of protein biomarkers, with the potential to understand a range of biological properties that could affect therapeutic response, metastasis and immune surveillance when coupled with simultaneous phenotyping of thousands of leukocytes.


Figures

Figure 1
Figure 1
Schematic workflow for protein profiling of rare cells identified with the HD-SCA workflow. (a) Sample processing and fluorescent imaging; (b) IMC staining and data acquisition; (c) Data processing.
Figure 2.
Figure 2.
Illustrations of segmentation and scoring of individual cells and aggregates. (a) HD-SCA composite image of LNCaP cells spiked in normal blood containing a cluster of cells in the center of the frame along with a single cell to the right. (b) Colored segmented cells in the IMC ROI. (c) Zoomed in LNCaP cluster of cells segmented using the DNA-Intercalator signal (blue) to outline the nuclei (yellow) as primary masks acting as seeds for propagation onto the membrane image to identify the outer cell boundaries (red). (d-g) Images showing the signal for individual IMC channels as labeled. (h) HD-SCA composite image of a single MDA-MB-231 cell spiked in normal blood. (i) Composite image, showing CD66 (red), CD44 (green) and DNA (blue), clearly showing the mutually exclusive populations of leukocytes (j-k). (l) Enlarged image of the MDA-MB-231 cell stained with CD44. (m-o) Biaxial plots of the segmented cells from ROI in Figure 2b with channels specified on the y-axis and CD45 on x-axis. The LNCaP cells are highlighted as green triangles (part of the cluster) or blue squares (single cell), with the associated score. The lines represents the estimated LOD based on either S/N (dashed), SDOM for all cells (solid) or SDOM based on the leukocytes only (dotted). (p) Biaxial plots of CD66 vs. CD44 on a log2 scale of the cells present in the ROI in I along with gating lines in blue. The MDA-MB-231 cell is shown as a blue triangle, scored as a 3.
Figure 3.
Figure 3.
Genomic profiles of cells found in the blood and bone marrow from the prostate cancer patient. (a) Genomic heat map displays the CNV profiles (chromosomal deletions in blue and amplification in red) for the CTC/DTC analyzed from the prostate cancer patient. (b) Representative CNV profiles of a CTC (left) and DTC (center, right) including 40x immunofluorescent composite images (DAPI, blue; CK, red; CD45, green; and AR white). The AR loci on X chromosome is highlighted (b, panel 1).
Figure 4.
Figure 4.
Combined IMC and HD-SCA characterization of circulating tumor cells from prostate cancer blood and bone marrow. (a) DTC (#1271) from a prostate cancer patient centered in the full frame ROI (400×400) together with cropped/zoomed in fluorescent images (top panel) and the IMC rendered images (bottom panels) as comparison for channel DAPI/Intercalator (blue), CK (red), CD45 (green) and as a 3 color composite image. The IMC generated results for EpCAM, AR-N, CD66, PSA, PSMA, E-cadherin and a lipid membrane counterstain are presented in green below. (b) Images of the CTC (#1290) with a similar expression profile from the same patient as in A. (c) 40x fluorescent images DAPI (blue), CD45 (green), and CK (red) of all the cells found and analyzed in the blood and bone marrow sample taken with optimal exposure for each cell. (d) Heat map of CTCs (green banner) and DTCs (blue banner) analyzed from the same patient colored according to the four step scoring scale; below detection (gray) detectable (yellow), strong (orange) and very strong (red) depending on the detected protein.
Figure 5.
Figure 5.
Immune cell phenotyping. Identification of subpopulations of leukocytes within the ROIs analyzed for sample MDA-42109 showing (a) conventional biaxial gating of cells (after initial size exclusion of non-single cells) to identify neutrophils (CD66+), cytotoxic T-cells (CD3+, CD8+), t-helper cells (CD3+, CD4+) and monocyte populations (HLA-Dr+, CD14+). (b) viSNE plots (SNE1 vs SNE2) of around 2000 cells captured with IMC in blood and (C) bone marrow, respectively. The larger image shows the same populations as gated above, overlaid by color. The smaller images show the individual markers with the expression represented as a gradient from low (blue) to high (red).

References

    1. Baca Q, Cosma A, Nolan G, Gaudilliere B. The road ahead: Implementing mass cytometry in clinical studies, one cell at a time. Cytometry Part B, Clinical cytometry 2017;92(1): 10–1. - PMC - PubMed
    1. Spitzer MH, Nolan GP. Mass Cytometry: Single Cells, Many Features. Cell 2016;165(4):780–91. - PMC - PubMed
    1. Bandura DR, Baranov VI, Ornatsky OI, Antonov A, Kinach R, Lou X, Pavlov S, Vorobiev S, Dick JE, Tanner SD. Mass cytometry: technique for real time single cell multitarget immunoassay based on inductively coupled plasma time-of-flight mass spectrometry. Analytical chemistry 2009;81(16):6813–22. - PubMed
    1. Wang HA, Grolimund D, Giesen C, Borca CN, Shaw-Stewart JR, Bodenmiller B, Gunther D. Fast chemical imaging at high spatial resolution by laser ablation inductively coupled plasma mass spectrometry. Analytical chemistry 2013;85(21): 10107–16. - PubMed
    1. Giesen C, et al. Highly multiplexed imaging of tumor tissues with subcellular resolution by mass cytometry. Nature Methods 2014;11(4):417–22. - PubMed

LinkOut - more resources