. 2019 Jan 17;8(4):e1564452.
doi: 10.1080/2162402X.2018.1564452. eCollection 2019.

CD8+ cytotoxic T cell responses to dominant tumor-associated antigens are profoundly weakened by aging yet subdominant responses retain functionality and expand in response to chemotherapy

Affiliations

CD8+ cytotoxic T cell responses to dominant tumor-associated antigens are profoundly weakened by aging yet subdominant responses retain functionality and expand in response to chemotherapy

Connie Jackaman et al. Oncoimmunology. .

Abstract

Increasing life expectancy is associated with increased cancer incidence, yet the effect of cancer and anti-cancer treatment on elderly patients and their immune systems is not well understood. Declining T cell function with aging in response to infection and vaccination is well documented, however little is known about aged T cell responses to tumor antigens during cancer progression or how these responses are modulated by standard chemotherapy. We examined T cell responses to cancer in aged mice using AE17sOVA mesothelioma in which ovalbumin (OVA) becomes a 'spy' tumor antigen containing one dominant (SIINFEKL) and two subdominant (KVVRFDKL and NAIVFKGL) epitopes. Faster progressing tumors in elderly (22-24 months, cf. 60-70 human years) relative to young (2-3 months, human 15-18 years) mice were associated with increased pro-inflammatory cytokines and worsened cancer cachexia. Pentamer staining and an in-vivo cytotoxic T lymphocyte (CTL) assay showed that whilst elderly mice generated a greater number of CD8+ T cells recognizing all epitopes, they exhibited a profound loss of function in their ability to lyse targets expressing the dominant, but not subdominant, epitopes compared to young mice. Chemotherapy was less effective and more toxic in elderly mice however, similar to young mice, chemotherapy expanded CTLs recognizing at least one subdominant epitope in tumors and draining lymph nodes, yet treatment efficacy still required CD8+ T cells. Given the significant dysfunction associated with elderly CTLs recognizing dominant epitopes, our data suggest that responses to subdominant tumor epitopes may become important when elderly hosts with cancer are treated with chemotherapy.

Keywords: Solid tumors; dominant and subdominant CD8+ T cell responses; elderly hosts with cancer; hierarchical T cell responses; mesothelioma; standard chemotherapy.


Figures

Figure 1.
Figure 1.
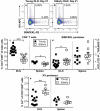
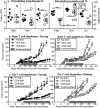
Faster growing tumors are associated with increased cancer cachexia in elderly mice. Young (n = 11) or elderly (n = 13) C57BL/6J mice (A) were inoculated with 5 × 105 AE17 cells s.c. and monitored daily for tumor growth (B) and body weight (C). Blood collection was performed at endpoint (based on tumor size of 120mm2, as per AEC conditions) and serum analyzed for cytokine expression (n = 10 healthy young, n = 11 AE17-bearing young mice; n = 5 healthy old; n = 7 old AE17-bearing mice (D), and alanine transaminase and total protein (n = 6 healthy young or old mice; n = 6 young AE17-bearing mice; n = 8 old AE17-bearing mice) (E), whilst 13 µl whole blood per mouse (n = 6 mice per group) was analyzed for circulating granulocytes (F) and lymphocytes (G) in blood. Data is represented as mean ± SEM from young or elderly mice in B and C, individual mice shown in D-G. * p < 0.05, ** p < 0.01, *** p < 0.001, analyzed by unpaired t-tests for 1B-G.
Figure 2.
Figure 2.
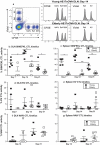
Elderly mice generate a quantitatively stronger CD8+ T cell response to dominant and subdominant tumor epitopes. Spleens and draining lymph nodes (DLN) were collected from young or elderly AE17-sOVA-bearing mice 21 days post tumor cell inoculation. Samples were stained for CD3, CD8, SIINFEKL and KV pentamers and analyzed by flow cytometry. Representative plots from young or elderly DLN gated on CD3+CD8+ are shown in A and B. Individual mice and mean ± SEM are shown for total CD8+ T cells (DLN n = 17 and 10, spleens n = 7 and 6, in young and old AE17-bearing mice respectively) (C), SIINFEKL pentamer (DLN n = 11 and 6, spleens n = 9 and 8, in young and old AE17-bearing mice respectively) (D) and KV pentamer (DLN n = 14 and 5, spleens n = 6 and 5, in young and old AE17-bearing mice respectively) (E). * p < 0.05, ** p < 0.01, *** p < 0.001 analyzed by Mann-Whitney U-test.
Figure 3.
Figure 3.
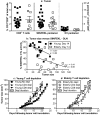
Elderly mice generate a qualitatively weaker CTL response to dominant and an equal response to subdominant epitopes. AE17-sOVA-bearing young or elderly mice were sampled at weekly intervals (day 7, day 14 and day 21) post tumor cell inoculation and analyzed for in vivo CTL activity in DLNs and spleens. Target cells were pooled LN and spleen cells from naïve C57BL/5J divided into five populations. The SIINFEKL-pulsed population was labeled with a high concentration of CFSE, NAIV-pulsed population labeled with a low concentration of CFSE and KV-pulsed population labeled with a high concentration of Violet dye. No peptide control cells were labeled with an intermediate concentration of CFSE or low concentration of Violet dye. The five populations were pooled equally and injected i.v. into mice for flow cytometry analysis 16–18 hours later. Representative flow cytometry plots displaying the five populations in a control mouse are shown in A, along with representative histograms for young or elderly AE17-sOVA-bearing mice in DLNs at day 14. Data from individual mice (n = 5 mice/group for all groups except day 7 elderly mice in which there were 3 mice/group) and mean ± SEM is shown for SIINFEKL (B and C), KV (D and E) and NAIV (F and G). * p < 0.05, ** p < 0.01 analyzed by Mann-Whitney U-test.
Figure 4.
Figure 4.
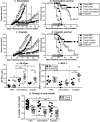
T cells in elderly mice cannot restrain tumor growth. Tumors were collected from young or elderly AE17-sOVA-bearing mice 21 days post tumor cell inoculation, stained for CD3, CD8 and SIINFEKL or KV pentamers and analyzed by flow cytometry (A) as per Figure 2. CD8+ T cell data from n = 24 young and 8 old mice, SIINFEKL pentamer data from n = 24 young and 12 old mice, and KV pentamer data from n = 18 young and 6 old mice; shown as individual mice and mean ± SEM, no age-related differences were seen, analyzed by Mann-Whitney U-test. In vivo CTL activity in DLNs at day14 was correlated by linear regression analysis with tumor size from AE17-sOVA-bearing young (n = 17) or elderly (n = 16) mice (B), data shown as individual mice. In a separate experiment, young (C) or old (D) AE17-bearing mice were depleted of CD4+ (n = 7 young and n = 8 old CD4 depleted mice, n = 13 young and n = 11 old no depletion control mice) or CD8+ T cells (n = 7 young and n = 8 old CD4 depleted mice, n = 8 young and old no depletion control mice) during tumor growth from day 7 to day 21; data shown as mean ± SEM. * p < 0.05, ** p < 0.01 analyzed by Mann-Whitney U-test.
Figure 5.
Figure 5.
Chemotherapy is not as effective and more toxic in elderly mice. AE17-bearing young or elderly mice were treated with the PBS diluent, gemcitabine (120 μg/g/dose every three days for two weeks; n = 12 mice/group) or cisplatin (6 μg/g/dose weekly for three weeks; n = 17 mice/group). Tumor growth (A and C), survival (B and D) and body weight (G) were monitored daily. Serum was analyzed for Alk Phos (E; n = 6 for all young and the healthy old group, n = 8 for other old groups) and MCP-1 (F; n = 5 for AE17-bearing young mice, n = 6 for healthy young AE17-bearing mice treated with either chemotherapy, and healthy old mice, n = 8 for all other old groups) at day 21. Individual mice and mean ± SEM are shown. * p < 0.05, ** p < 0.01, *** p < 0.001 analyzed by Mann-Whitney U-test.
Figure 6.
Figure 6.
Chemotherapy efficacy in elderly mice still requires T cells. AE17-bearing young or elderly mice were treated with gemcitabine or cisplatin and blood analyzed for circulating lymphocytes at day 21 (A and B, individual mice and mean ± SEM shown; n = 6 mice/group for young and old healthy mice, AE17-bearing mice given the PBS diluent control, and young AE17-bearing treated with either chemotherapy, n = 7 and 8 for old AE17-bearing mice treated with cisplatin or gemcitabine respectively). In a separate experiment, AE17-bearing mice were depleted of CD4+ (n = 12 for young and old no depletion controls, n = 8 old CD4 depleted and n = 7 young CD4 depleted) or CD8+ T cells (n = 8 for young and old no depletion controls, n = 8 old CD8 depleted and n = 6 young CD8 depleted) using monoclonal antibodies two days before the start of either gemcitabine (C and D) or cisplatin (E and F) chemotherapy; antibody depletions were continued for 14 days; data shown as mean ± SEM. * p < 0.05, ** p < 0.01, *** p < 0.001, **** p < 0.0001 analyzed using unpaired t-tests for 6A and B.
Figure 7.
Figure 7.
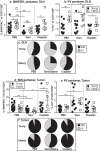
Gemcitabine increases subdominant CD8+ T cells in elderly tumors. DLNs (A and B) and tumors (D and E) from AE17-sOVA-bearing young or elderly mice treated with gemcitabine or cisplatin were collected at day 21, stained for CD3, CD8, SIINFEKL (A and D) and KV pentamers (B and E) and analyzed by flow cytometry (as per Figure 2). Individual mice and mean ± SEM are shown for SIINFEKL pentamer (A; n = 17 and 9 young and elderly untreated mice respectively, n = 11 young, n = 6 elderly chemotherapy treated mice, B; n = 9 and 8 young and elderly untreated mice respectively, n = 6 young and elderly chemotherapy treated mice, and F: n = 24 and 12 young and elderly untreated mice respectively, n = 11–12 young and n = 6 elderly chemotherapy treated mice), KV pentamer (C; n = 14 and 5 young and elderly untreated mice respectively, n = 11 young, n = 5 elderly chemotherapy treated mice, D; n = 6 and 5 young and elderly untreated mice respectively, n = 6 young and elderly chemotherapy treated mice, and G; n = 18 and 6 young and elderly untreated mice, n = 11–12 young and n = 6 elderly chemotherapy treated mice) and total CD8+ T cells (E; n = 23 and 8 untreated young and elderly untreated mice, n = 11–12 young and n = 6–8 elderly chemotherapy treated mice). * p < 0.05, ** p < 0.01, *** p < 0.001 analyzed by Mann-Whitney U-test. Figures C (in DLN) and F (in tumors) show the proportional relationship between SIINFEKL and KV pentamer positive T cells as parts of a whole.
Figure 8.
Figure 8.
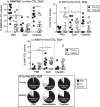
Gemcitabine enhances CTL responses to the NAIVFKGL subdominant epitope in elderly mice DLN. AE17-sOVA-bearing mice treated with PBS (n = 12 young and 11 elderly mice), gemcitabine (n = 9 young and 11 elderly mice), or cisplatin (n = 9 young and 11 elderly mice), were analyzed for in vivo CTL activity (as per Figure 3) in DLNs and spleens at day 21. Individual mice and mean ± SEM are shown for SIINFEKL activity (A and B), KV activity (C and D) and NAIV activity (E and F). * p < 0.05, ** p < 0.01, *** p < 0.001 analyzed by Mann-Whitney U-test. Figure D shows the proportional relationship between SIINFEKL, KV and NAIV CTL activity as parts of a whole. Total CTL activity refers to the sum of SIINFEKL, KV and NAIV CTL activity.

Similar articles

Cited by

References

    1. United Nations World population prospects. 2017. [accessed 2017 Oct 19]. http://www.pewglobal.org/2014/01/30/global-population/.
    1. Odgerel CO, Takahashi K, Sorahan T, Driscoll T, Fitzmaurice C, Yoko OM, Sawanyawisuth K, Furuya S, Tanaka F, Horie S, et al. Estimation of the global burden of mesothelioma deaths from incomplete national mortality data. Occup Environ Med. 2017;74:851–858. doi:10.1136/oemed-2017-104298. - DOI - PMC - PubMed
    1. Takahashi K, Landrigan PJ, Collegium R.. The global health dimensions of asbestos and asbestos-related diseases. Ann Glob Health. 2016;82:209–213. doi:10.1016/j.aogh.2016.01.019. - DOI - PubMed
    1. Bianchi C, Bianchi T.. Malignant mesothelioma: global incidence and relationship with asbestos. Ind Health. 2007;45:379–387. - PubMed
    1. Musk AW, Olsen N, Alfonso H, Reid A, Mina R, Franklin P, Sleith J, Hammond N, Threlfall T, Shilkin KB, et al. Predicting survival in malignant mesothelioma. Eur Respir J. 2011;38:1420–1424. doi:10.1183/09031936.00000811. - DOI - PubMed

Publication types