. 2019 Mar 20;5(3):eaau7518.
doi: 10.1126/sciadv.aau7518. eCollection 2019 Mar.

Hypoxia and matrix viscoelasticity sequentially regulate endothelial progenitor cluster-based vasculogenesis

Affiliations

Hypoxia and matrix viscoelasticity sequentially regulate endothelial progenitor cluster-based vasculogenesis

Michael R Blatchley et al. Sci Adv. .

Abstract

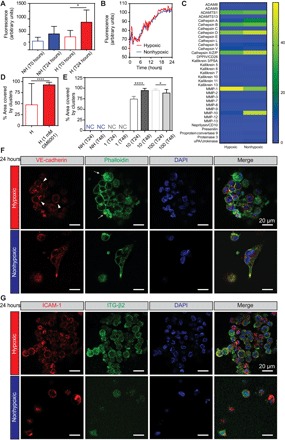
Vascular morphogenesis is the formation of endothelial lumenized networks. Cluster-based vasculogenesis of endothelial progenitor cells (EPCs) has been observed in animal models, but the underlying mechanism is unknown. Here, using O2-controllabe hydrogels, we unveil the mechanism by which hypoxia, co-jointly with matrix viscoelasticity, induces EPC vasculogenesis. When EPCs are subjected to a 3D hypoxic gradient ranging from <2 to 5%, they rapidly produce reactive oxygen species that up-regulate proteases, most notably MMP-1, which degrade the surrounding extracellular matrix. EPC clusters form and expand as the matrix degrades. Cell-cell interactions, including those mediated by VE-cadherin, integrin-β2, and ICAM-1, stabilize the clusters. Subsequently, EPC sprouting into the stiffer, intact matrix leads to vascular network formation. In vivo examination further corroborated hypoxia-driven clustering of EPCs. Overall, this is the first description of how hypoxia mediates cluster-based vasculogenesis, advancing our understanding toward regulating vascular development as well as postnatal vasculogenesis in regeneration and tumorigenesis.


Figures

Fig. 1
Fig. 1. ECFC clusters form only under hypoxic conditions.
(A) Schematic for hypoxic and nonhypoxic cell encapsulation. (B) Bright-field images of cell morphology in hypoxic and nonhypoxic hydrogels up to 48 hours. Hypoxic hydrogels exhibit cluster morphology starting at approximately 6 to 12 hours in culture. Clusters expand up to 48 hours. ECFCs encapsulated in nonhypoxic hydrogels do not form clusters but rather branch and sprout. (C) O2 tension, measured at the bottom of the gel over 4 days in culture. (D) Time-lapse microscopy and (E) subsequent quantification of number of cells in clusters (top) and single cells (bottom) confirm observations of cluster formation kinetics in hypoxic hydrogels. (F and G) Clusters do not form in nonhypoxic hydrogels.
Fig. 2
Fig. 2. Cluster formation is dependent on hypoxia-induced ROS and matrix stiffness.
(A) Treatment with PHD inhibitors (DMOG and CoCl2), which act to stabilize HIFs, did not result in cluster formation in hydrogels with the same dimensions as nonhypoxic (NH) hydrogels. NC, no clusters. Scale bars, 100 μm. (B) siRNA knockdown of HIF1α did not affect cluster formation. scr, non-targeting siRNA #1. n.s., not significant. (C) Treatment with DPI, a ROS inhibitor, blocked cluster formation in hypoxic (H) conditions. Scale bars, 100 μm. (D and E) Addition of microbial transglutaminase (mTG) increases the stiffness of hydrogels. Ctl, control hydrogel with no mTG. (F and G) Upon addition of mTG, robust morphological changes can be observed. Decreased cluster size indicates the importance of matrix mechanics. (F) Time-lapse microscopy and (G) quantification of number of cells in clusters (top) and single cells (bottom) confirm observations of decreased cluster size. All graphical data are reported as means ± SD. ****P < 0.0001.
Fig. 3
Fig. 3. MMP-1–mediated matrix degradation is required for cluster formation and stabilization.
(A) DQ quantification along culture period. Increasing fluorescence indicates the presence of proteases. H, n = 6; NH, n = 4. (B) Representative quantification of fluorescence signal over the course of the experiment. (C) Proteome profiler protease array showing that only MMP-1 is increased in hypoxic compared to nonhypoxic conditions. Results are presented as the mean pixel density of two arrays. (D) Media supplemented with 1 mM GM6001 inhibited cluster formation in hypoxic hydrogels. (E) Exogenous MMP supplementation facilitates dose-dependent cluster formation in nonhypoxic hydrogels. (F) Cluster stabilization is shown under hypoxic conditions by vascular endothelial cadherin (VE-cad) localization between some, but not all, cells in clusters, indicating cell-cell interactions (arrowheads). F-actin phalloidin staining localized at the cell membrane shows structures resembling filopodia (arrows). Clusters are rare in nonhypoxic hydrogels, but some cellular sprouting is present. (G) ICAM-1 and ITG-β2 are present at the cell membrane within hypoxia-induced clusters, indicating cell-cell interactions. Only a few cell-cell interactions are observed under nonhypoxic conditions. Scale bars, 20 μm. Graphical data in (A), (D), and (E) are reported as means ± SD. *P < 0.05, and ****P < 0.0001.
Fig. 4
Fig. 4. Sprouting is enhanced via ECM interactions and as matrix stiffness increases.
(A) Orthogonal projections, XY (bottom left), YZ (top left), and XZ (bottom right), show that (i) both multicellular (arrow) and unicellular lumen (arrowheads) are present in vascular networks and (ii) vascular networks spread in three dimensions (XY, YZ, and XZ), but only in the (−) Z direction. (B) Cell-ECM interactions increase from 24 to 72 hours. (i) At 24 hours (D1), ECFCs exhibit membrane or diffuse cytosolic F-actin (phalloidin) localization. ECFCs begin to show filopodia extending into the surrounding matrix (arrowhead). At 72 hours (D3), ECFCs establish cytoskeletal F-actin fibers indicative of cell-ECM interactions (arrows). D1 image reproduced from Fig. 3F (phalloidin) for ease of comparison. (ii) Stress fiber quantification reveals an increased number of stress fibers per cell between 24 and 72 hours. (iii) Representative quantification data for a cell at 24 hours (gray) and 72 hours (black). Graphical data in (B) are reported as means ± SD of quantification of 123 cells (24 hours) and 100 cells (72 hours). ****P < 0.0001. (C) Vascular network formation is accelerated with the addition of mTG as shown by (i) bright-field images on day 2 of culture (sprouts indicated by arrowheads) and (ii) subsequent quantification. Ctl, n = 9 gels. mTG, n = 18 gels. (D) Vascular tubes cover a higher percentage of the analyzed fields of view with the addition of mTG. Ctl, n = 5 gels. mTG, n = 8 gels. Graphical data in (D) are reported as means ± SD. *P < 0.05. (E) Stress fiber quantification for control (red) and mTG-treated hydrogels (gray), measured at 72 hours. Graphical data in (E) are reported as means ± SD of quantification of 120 cells (ctl) and 118 cells (mTG). ****P < 0.0001.
Fig. 5
Fig. 5. Gel-HI hydrogels facilitate ECFC cluster formation in vivo.
(A) Intracardiac injection of GFP-ECFCs, followed by injection of SDF-1α loaded nonhypoxic and hypoxic hydrogels into the flank of nu/nu mice. (B) Twelve hours after injection, GFP-ECFCs exhibited single-cell spindle (i) or rounded (ii) morphology in nonhypoxic hydrogels. Host cells (GS-IB4 lectin) were also present as isolated, rounded cells. Under hypoxic conditions, GFP-ECFCs were present in clusters (iii and iv), with some clusters containing sprouting cells (iii). Host cells also exhibited cluster morphology under hypoxic conditions (iii and iv). (C) Quantification revealed a similar number of cells under both conditions and (D) a slight increase in percent area covered by clusters under hypoxic compared to nonhypoxic conditions. (E) Clusters were larger under hypoxic than under nonhypoxic conditions. (F) Intracardiac injection of GFP-ECFCs followed by injection of SDF-1α loaded hypoxic (ctl) and hypoxic (DPI) hydrogels into the flank of nu/nu mice. (G) Twelve hours after encapsulation, GFP-ECFCs were present as both single cells (ii and iii) and clusters (i and iv) under both conditions. (H) An increased number of GFP+ cells were present in the control group, and (I) the percent area covered by clusters was increased in the control versus DPI-treated group. (J) Mean cluster sizes between the two groups were not statistically significantly different. n = 6 nu/nu mice per experiment. Graphical data in (C), (D), (H), and (I) are reported as box and whisker plots from minimum to maximum. Graphical data in (E) and (J) are reported as means ± SD, with all points denoted by dots. *P < 0.05.
Fig. 6
Fig. 6. A mechanism for cluster-based vasculogenesis.
(A) EPCs (ECFCs) are recruited to injured or diseased tissues in need of new vasculature. These cells then migrate to hypoxic regions. (B) Hypoxia induces production of ROS, which leads to up-regulation of MMP-1 and other proteases, followed by matrix degradation, resulting in cluster formation. (C) Clusters are stabilized by cell-cell interactions (VE-cad, ICAM-1, and ITG-β2). (D) Cells interact with the surrounding ECM to form vascular networks. Increases in matrix viscoelasticity result in accelerated and enhanced vascular networks.

Similar articles

Cited by

References

    1. Ferkowicz M. J., Yoder M. C., Blood island formation: Longstanding observations and modern interpretations. Exp. Hematol. 33, 1041–1047 (2005). - PubMed
    1. McGrath K. E., Koniski A. D., Malik J., Palis J., Circulation is established in a stepwise pattern in the mammalian embryo. Blood 101, 1669–1675 (2003). - PubMed
    1. Francis S. E., Goh K. L., Hodivala-Dilke K., Bader B. L., Stark M., Davidson D., Hynes R. O., Central roles of α5β1 integrin and fibronectin in vascular development in mouse embryos and embryoid bodies. Arterioscler. Thromb. Vasc. Biol. 22, 927–933 (2002). - PubMed
    1. Drake C. J., Fleming P. A., Vasculogenesis in the day 6.5 to 9.5 mouse embryo. Blood 95, 1671–1679 (2000). - PubMed
    1. Ellertsdóttir E., Lenard A., Blum Y., Krudewig A., Herwig L., Affolter M., Belting H.-G., Vascular morphogenesis in the zebrafish embryo. Dev. Biol. 341, 56–65 (2010). - PubMed

Publication types

MeSH terms

LinkOut - more resources