. 2019 Mar 20;5(3):eaav0316.
doi: 10.1126/sciadv.aav0316. eCollection 2019 Mar.

Newly developed reversible MAO-B inhibitor circumvents the shortcomings of irreversible inhibitors in Alzheimer's disease

Affiliations

Newly developed reversible MAO-B inhibitor circumvents the shortcomings of irreversible inhibitors in Alzheimer's disease

Jong-Hyun Park et al. Sci Adv. .

Abstract

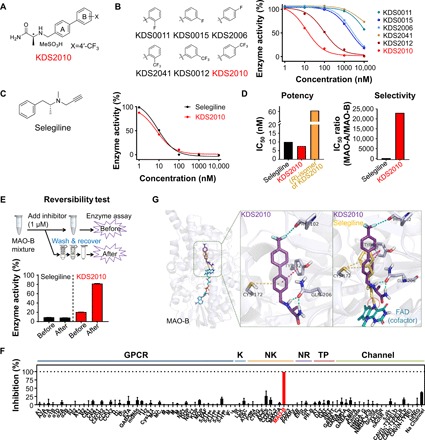
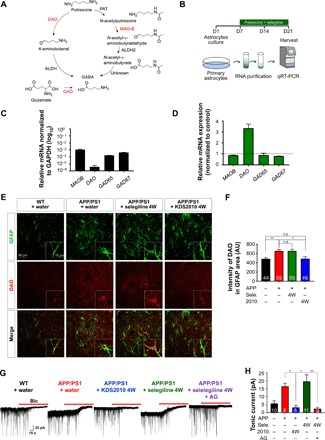
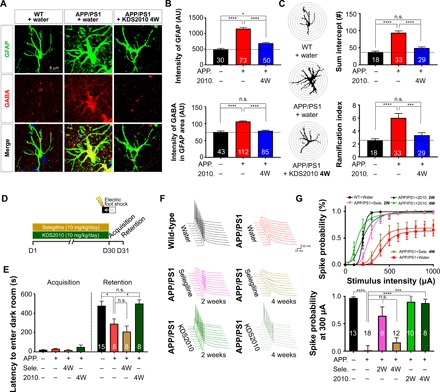
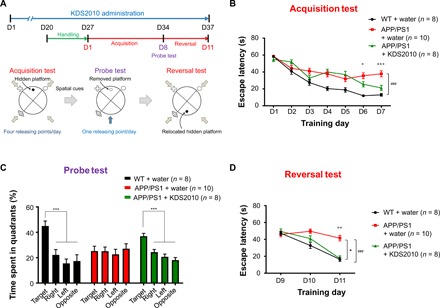
Monoamine oxidase-B (MAO-B) has recently emerged as a potential therapeutic target for Alzheimer's disease (AD) because of its association with aberrant γ-aminobutyric acid (GABA) production in reactive astrocytes. Although short-term treatment with irreversible MAO-B inhibitors, such as selegiline, improves cognitive deficits in AD patients, long-term treatments have shown disappointing results. We show that prolonged treatment with selegiline fails to reduce aberrant astrocytic GABA levels and rescue memory impairment in APP/PS1 mice, an animal model of AD, because of increased activity in compensatory genes for a GABA-synthesizing enzyme, diamine oxidase (DAO). We have developed a potent, highly selective, and reversible MAO-B inhibitor, KDS2010 (IC50 = 7.6 nM; 12,500-fold selectivity over MAO-A), which overcomes the disadvantages of the irreversible MAO-B inhibitor. Long-term treatment with KDS2010 does not induce compensatory mechanisms, thereby significantly attenuating increased astrocytic GABA levels and astrogliosis, enhancing synaptic transmission, and rescuing learning and memory impairments in APP/PS1 mice.


Figures

Fig. 1
Fig. 1. The diminishing effect of long-term selegiline treatment.
(A) Immunostaining for GFAP, GABA, and DAPI (4′,6-diamidino-2-phenylindole) after oral administration of selegiline (10 mg/kg for 3 days or 4 weeks) in APP/PS1 mice (n = 4 for each group; both male and female mice aged 8 to 11 months were used). Inset: Magnified images. (B) Mean intensity of GABA in GFAP-positive areas. ****P < 0.0001, Kruskal-Wallis test with Dunnett’s multiple comparisons test. (C) Representative traced astrocytes from images such as those shown in (A) were superimposed over concentric circles for Sholl analysis. (D) Quantification of the total number of intercepts in a single astrocyte. **P < 0.01 and ****P < 0.0001, one-way analysis of variance (ANOVA) with Tukey’s multiple comparisons test. (E) Quantification of the ramification index of traced astrocytes. ****P < 0.0001, Kruskal-Wallis test with Dunnett’s multiple comparisons test. (F) Passive avoidance test results of WT and APP/PS1 mice, which either received or did not receive selegiline orally (10 mg/kg for either 3 days or 4 weeks). Left: Experimental protocol for the passive avoidance test. Right: Latency to enter the dark chamber during the passive avoidance test. *P < 0.05, Kruskal-Wallis test with Dunnett’s multiple comparisons test. AU, arbitary unit; APP., APP/PS1 mice; Sele., selegiline; 3D, 3-day treatment; 4W, 4-week treatment. n refers to the number of cells (A and C) or mice (D) analyzed. n.s., not significant. Data are presented as means ± SEM. Bar graphs showing data distribution are presented in fig. S10.
Fig. 2
Fig. 2. KDS2010 is a potent, selective, and reversible MAO-B inhibitor.
(A) Chemical structure of KDS2010. (B) Chemical structures and concentration-enzyme activity curves of the selected KDS derivatives in the MAO-B enzyme assay (n = 4 assays). (C) Comparison to the well-known irreversible MAO-B inhibitor. Left: Chemical structure of selegiline. Right: Concentration-enzyme activity curves for selegiline and KDS2010 in the MAO-B enzyme assay (n = 4 assays). (D) Potency and selectivity of selegiline and KDS2010 based on IC50 (in nM) levels of MAO-B and the isoform MAO-A. (E) Top: Diagram of the reversibility assay protocol. Bottom: Enzyme activity normalized to the dimethyl sulfoxide–treated group at each “before” and “after” step. (F) The off-target selectivity for 87 primary molecular targets at 1 μM KDS2010. A significant response (≥50% inhibition for biochemical assays) was only observed for MAO-B (>99% inhibition; n = 2 assays; red bar). GPCR, G protein–coupled receptor; K, kinase; NK, non-kinase; NR, nuclear receptor; TP, transporter; Channel, ion channel. See table S4 for the detailed results. (G) Left: Binding position of selegiline (yellow), flavin adenine dinucleotide (FAD) (cyan), and KDS2010 (purple) inside the MAO-B binding pocket. Middle: Molecular interactions of KDS2010 are indicated by the dashed line [halogen bond (cyan), π-sulfur interaction (yellow), π-π T-shaped (magenta), and hydrogen bond (green)]. Right: Selegiline was covalently bound to FAD, an MAO-B cofactor (red dotted circle).
Fig. 3
Fig. 3. Compensatory metabolic pathways during long-term selegiline treatment.
(A) Schematic diagram of the metabolic pathway leading to GABA synthesis. (B) The experimental protocol for measuring mRNA levels by quantitative real-time polymerase chain reaction (qRT-PCR) in primary cultured astrocytes treated with selegiline (100 nM) and putrescine (180 μM) for 2 weeks. (C) Relative mRNA expression normalized to GAPDH (log10). (D) Relative mRNA expression of MAOB (0.88; n = 2), DAO (3.34; n = 2), GAD65 (0.88; n = 2), and GAD67 (0.80; n = 2). Expression levels of MAOB, DAO, GAD65, and GAD67 mRNAs in control naïve astrocytes were used to normalize different conditions. GAPDH mRNA levels were used to normalize the expression of each gene. (E) Immunostaining for GFAP and DAO after the oral administration of either selegiline or KDS2010 (10 mg/kg for 4 weeks) in APP/PS1 mice. Inset: Magnified images. (F) Mean intensity of DAO in GFAP-positive areas. *P < 0.05 and **P < 0.01, Kruskal-Wallis test and Dunnett’s multiple comparisons test. (G) Representative trace of GABAA receptor–mediated currents recorded from granule cells in the DG [n = 10 for WT + water; n = 8 for APP/PS1 + water; n = 8 for APP/PS1 + KDS2010 (10 mg/kg) for 4 weeks; n = 11 for APP/PS1 + selegiline (10 mg/kg) for 4 weeks; n = 9 for APP/PS1 + selegiline (10 mg/kg) for 4 weeks with 100 nM AG; both male and female mice aged 10 to 11 months were used]. The red bar indicates application of the GABAA receptor antagonist bicuculline (BIC) (20 μM). (H) Tonic GABA current generated by bicuculline. 2010, KDS2010. *P < 0.05 and **P < 0.01, Kruskal-Wallis test and Dunnett’s multiple comparisons test. Data are presented as means ± SEM. Bar graphs showing data distribution are presented in fig. S10.
Fig. 4
Fig. 4. Impairments in spike probability, learning, and memory are fully ameliorated by long-term treatment with KDS2010 but not by selegiline.
(A) Immunostaining for GFAP and GABA after oral administration of KDS2010 (10 mg/kg for 4 weeks) in APP/PS1 mice (n = 6 for each group; both male and female mice aged 8 to 11 months were used). (B) Mean intensity of GFAP and GABA in GFAP-positive areas. *P < 0.05 and ****P < 0.0001, one-way ANOVA with Tukey’s multiple comparisons test or Kruskal-Wallis test with Dunnett’s multiple comparisons test. (C) Left: Representative traced astrocytes were superimposed over concentric circles for Sholl analysis. Right: Quantification of the total number of intercepts (top) and the ramification index (bottom). ***P < 0.001 and ****P < 0.0001, one-way ANOVA with Tukey’s multiple comparisons test or Kruskal-Wallis test with Dunnett’s multiple comparisons test. (D) Experimental protocol for the passive avoidance test following long-term treatment with either KDS2010 or selegiline. (E) Latency to enter the dark chamber during the passive avoidance test. *P < 0.05, Kruskal-Wallis test with Dunnett’s multiple comparisons test. (F) Evoked spike probability in hippocampal slices obtained from selegiline- or KDS2010-treated mice (10 mg/kg, oral administration) in response to electrical stimulation of the perforant path (0.1 Hz, 100 μs, 100 to 1,000 μA). WT + water, APP/PS1 + water, APP/PS1 + selegiline 2W, and APP/PS1 + selegiline 4W groups include some samples from our previous study (14) (G) Top: Summary graph of spike probability versus stimulus intensity in Fig. 4D. Bottom: Comparison of spike probability at 300-μA stimulation after 2- or 4-week administration of selegiline or KDS2010. ***P < 0.001 and ****P < 0.0001, one-way ANOVA with Kruskal-Wallis test with Dunnett’s multiple comparisons test. 2W, 2-week treatment. n refers to the number of cells (B and C) or mice (D and E) tested. Data are presented as means ± SEM. Bar graphs showing data distribution are presented in fig. S10.
Fig. 5
Fig. 5. KDS2010 significantly reversed spatial learning and memory impairments in the Morris water maze test.
(A) The protocol for the Morris water maze test for APP/PS1 mice that either received or did not receive KDS2010 orally (10 mg/kg per day for 37 days; male mice 10 to 12 months of age). Acquisition tests were performed four times per day for 7 days. The probe test was conducted on the eighth day without the platform. The reversal test was performed four times per day for three consecutive days. (B) Escape latency during acquisition test. ###P < 0.001, compared with WT + water (one-way repeated measures ANOVA). +P < 0.05 and +++P < 0.001, compared with APP/PS1 + water [one-way ANOVA with Fisher’s least significant difference (LSD) analysis for each day]. (C) Time spent in each quadrant during the probe test. ***P < 0.001, compared with target quadrant (one-way ANOVA with Fisher’s LSD). (D) Escape latency during reversal test. *P < 0.05, compared with APP/PS1 + water and ###P < 0.001, compared with WT + water (one-way repeated measures ANOVA). P < 0.05 and ++P < 0.01 compared with APP/PS1 (one-way ANOVA with Fisher’s LSD analysis for each day). Data are presented as means ± SEM. Bar graphs showing data distribution are presented in fig. S10.

References

    1. Alzheimer's Association , 2012 Alzheimer's disease facts and figures. Alzheimers Dement. 8, 131–168 (2012). - PubMed
    1. Alzheimer's Association , 2015 Alzheimer's disease facts and figures. Alzheimers Dement. 11, 332–384 (2015). - PubMed
    1. Querfurth H. W., LaFerla F. M., Alzheimer’s Disease. N. Engl. J. Med. 362, 329–344 (2010). - PubMed
    1. Heneka M. T., Carson M. J., Khoury J. E., Landreth G. E., Brosseron F., Feinstein D. L., Jacobs A. H., Wyss-Coray T., Vitorica J., Ransohoff R. M., Herrup K., Frautschy S. A., Finsen B., Brown G. C., Verkhratsky A., Yamanaka K., Koistinaho J., Latz E., Halle A., Petzold G. C., Town T., Morgan D., Shinohara M. L., Perry V. H., Holmes C., Bazan N. G., Brooks D. J., Hunot S., Joseph B., Deigendesch N., Garaschuk O., Boddeke E., Dinarello C. A., Breitner J. C., Cole G. M., Golenbock D. T., Kummer M. P., Neuroinflammation in Alzheimer’s disease. Lancet Neurol. 14, 388–405 (2015). - PMC - PubMed
    1. Hardy J., Allsop D., Amyloid deposition as the central event in the aetiology of Alzheimer's disease. Trends Pharmacol. Sci. 12, 383–388 (1991). - PubMed

Publication types

MeSH terms