

1,25-Dihydroxyvitamin D exerts an antiaging role by activation of Nrf2-antioxidant signaling and inactivation of p16/p53-senescence signaling
- PMID: 30907059
- PMCID: PMC6516172
- DOI: 10.1111/acel.12951
1,25-Dihydroxyvitamin D exerts an antiaging role by activation of Nrf2-antioxidant signaling and inactivation of p16/p53-senescence signaling
Retraction in
-
RETRACTION: 1,25-Dihydroxyvitamin D exerts an antiaging role by activation of Nrf2-antioxidant signaling and inactivation of p16/p53-senescence signaling.Aging Cell. 2024 Nov;23(11):e14383. doi: 10.1111/acel.14383. Epub 2024 Oct 18. Aging Cell. 2024. PMID: 39424609 Free PMC article.
Abstract
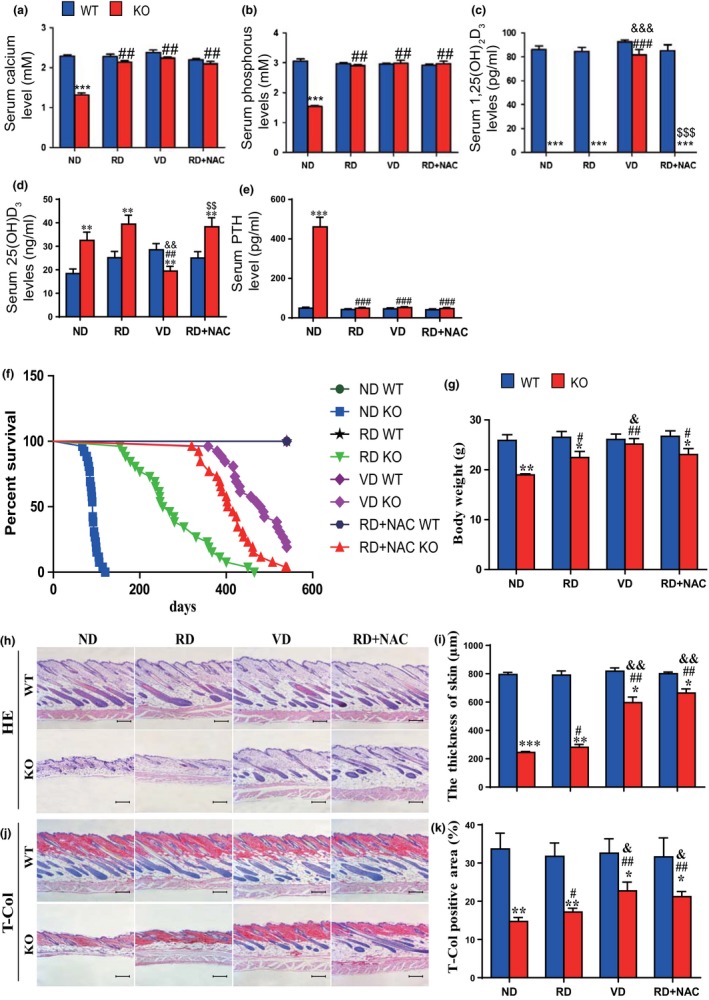
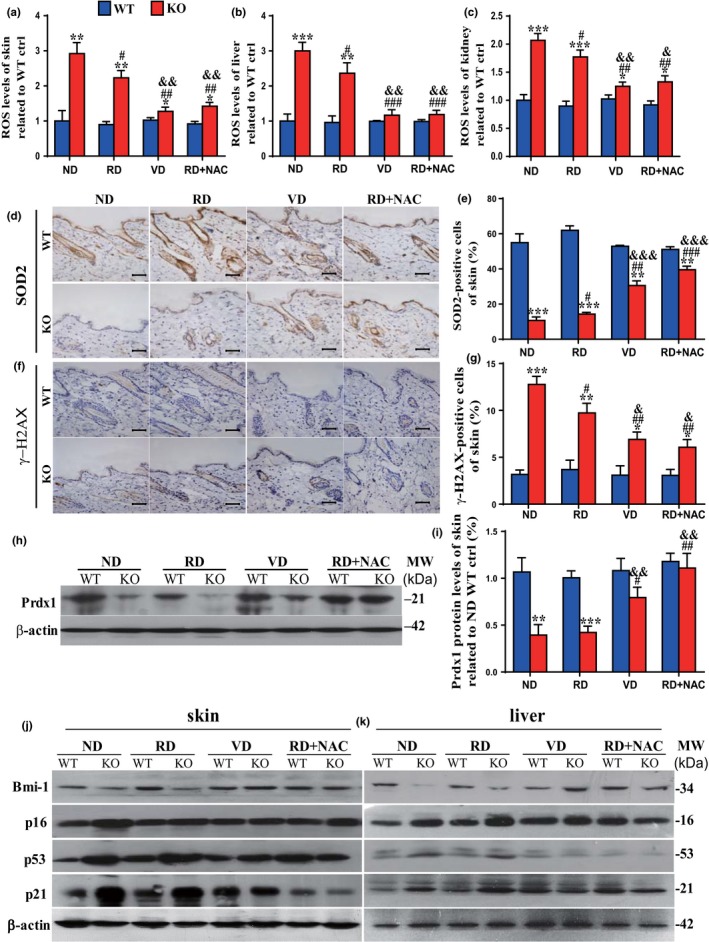
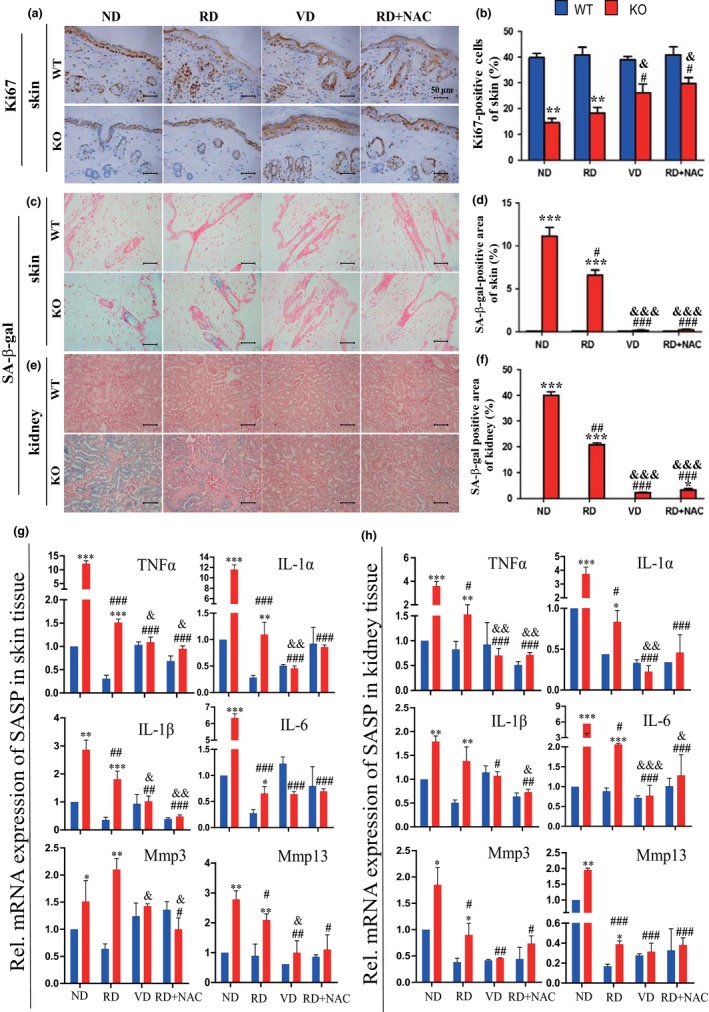
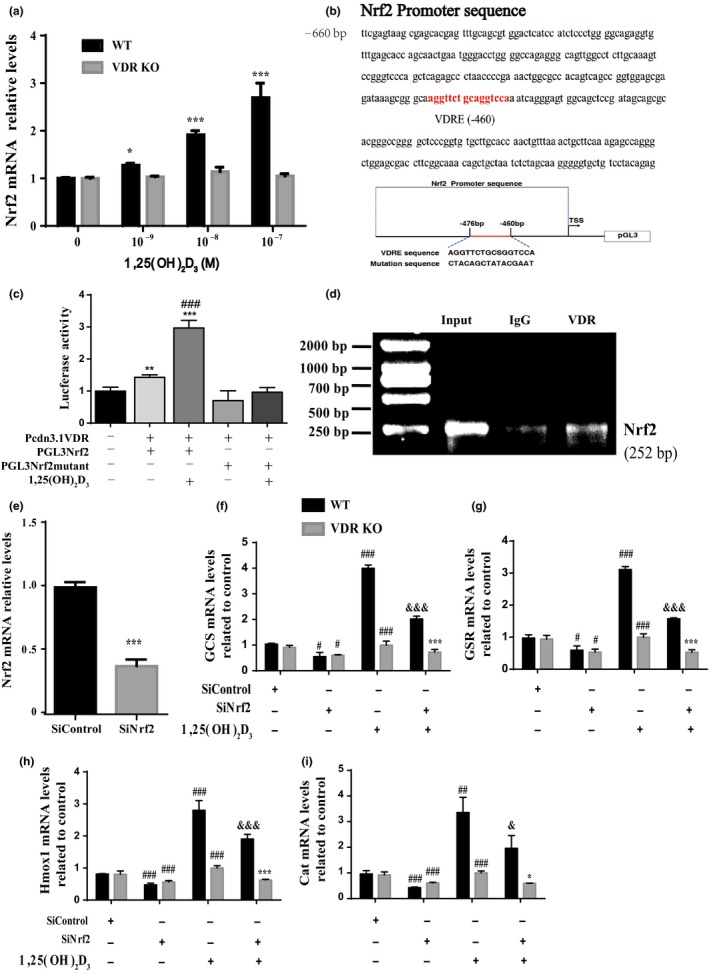
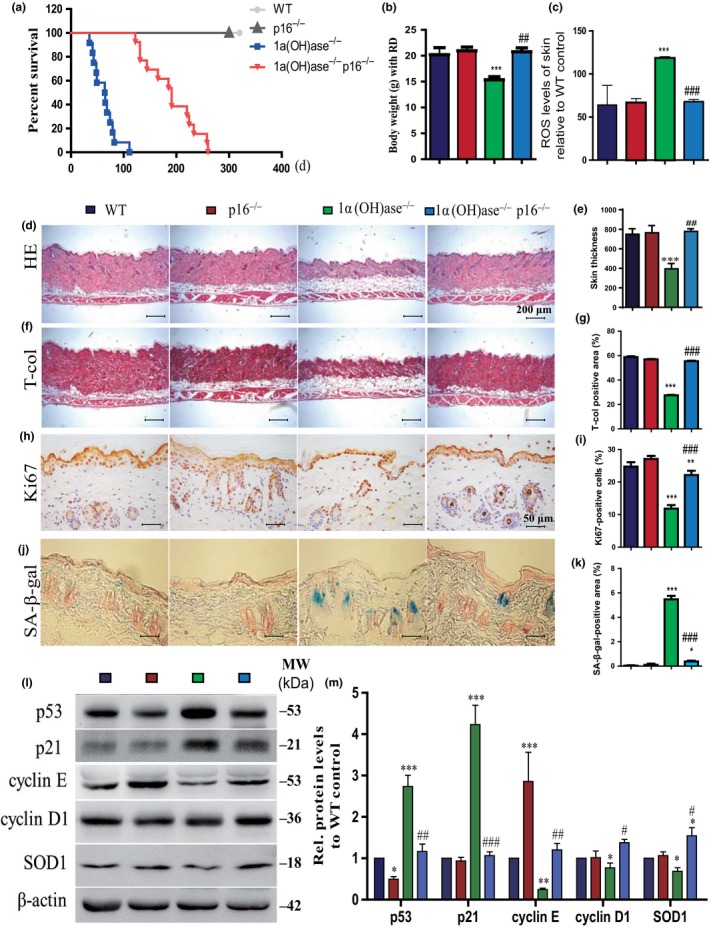
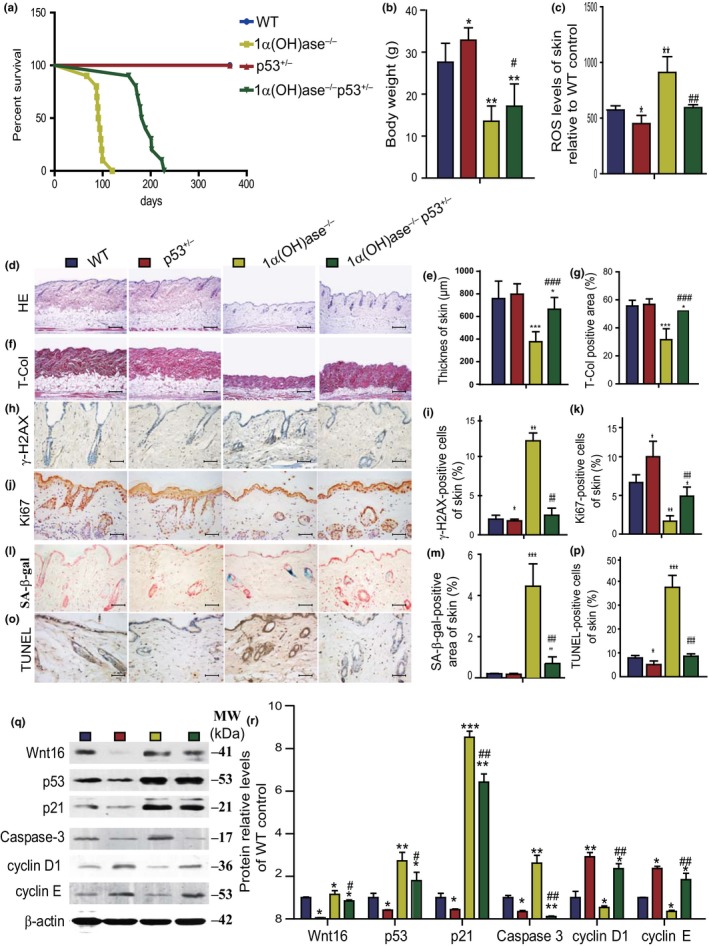
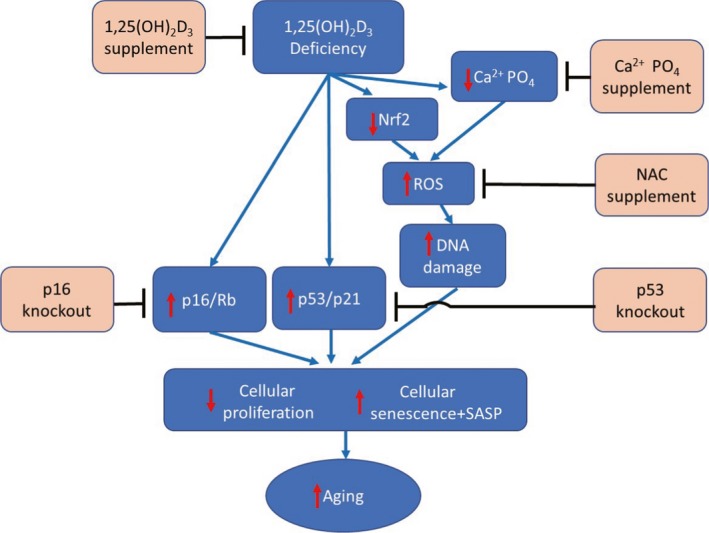
We tested the hypothesis that 1,25-dihydroxyvitamin D3 [1α,25(OH)2 D3 ] has antiaging effects via upregulating nuclear factor (erythroid-derived 2)-like 2 (Nrf2), reducing reactive oxygen species (ROS), decreasing DNA damage, reducing p16/Rb and p53/p21 signaling, increasing cell proliferation, and reducing cellular senescence and the senescence-associated secretory phenotype (SASP). We demonstrated that 1,25(OH)2 D3 -deficient [1α(OH)ase-/- ] mice survived on average for only 3 months. Increased tissue oxidative stress and DNA damage, downregulated Bmi1 and upregulated p16, p53 and p21 expression levels, reduced cell proliferation, and induced cell senescence and the senescence-associated secretory phenotype (SASP) were observed. Supplementation of 1α(OH)ase-/- mice with dietary calcium and phosphate, which normalized serum calcium and phosphorus, prolonged their average lifespan to more than 8 months with reduced oxidative stress and cellular senescence and SASP. However, supplementation with exogenous 1,25(OH)2 D3 or with combined calcium/phosphate and the antioxidant N-acetyl-l-cysteine prolonged their average lifespan to more than 16 months and nearly 14 months, respectively, largely rescuing the aging phenotypes. We demonstrated that 1,25(OH)2 D3 exerted an antioxidant role by transcriptional regulation of Nrf2 via the vitamin D receptor (VDR). Homozygous ablation of p16 or heterozygous ablation of p53 prolonged the average lifespan of 1α(OH)ase-/- mice on the normal diet from 3 to 6 months by enhancing cell proliferative ability and reducing cell senescence or apoptosis. This study suggests that 1,25(OH)2 D3 plays a role in delaying aging by upregulating Nrf2, inhibiting oxidative stress and DNA damage,inactivating p53-p21 and p16-Rb signaling pathways, and inhibiting cell senescence and SASP.
Keywords: Nrf2; aging; cell senescence; p16 and p53; vitamin D.
© 2019 The Authors. Aging Cell published by the Anatomical Society and John Wiley & Sons Ltd.
Conflict of interest statement
None declared.
Figures
Similar articles
-
1,25-Dihydroxyvitamin D protects against age-related osteoporosis by a novel VDR-Ezh2-p16 signal axis.Aging Cell. 2020 Feb;19(2):e13095. doi: 10.1111/acel.13095. Epub 2019 Dec 26. Aging Cell. 2020. PMID: 31880094 Free PMC article.
-
1,25-Dihydroxyvitamin D deficiency accelerates male reproductive senescence in aging mice and 1,25(OH)2D3 alleviates oxidative stress via NF-κB/SOD.Am J Physiol Endocrinol Metab. 2021 Apr 1;320(4):E732-E746. doi: 10.1152/ajpendo.00531.2020. Epub 2021 Feb 15. Am J Physiol Endocrinol Metab. 2021. PMID: 33586492
-
Interferon-gamma induces cellular senescence through p53-dependent DNA damage signaling in human endothelial cells.Mech Ageing Dev. 2009 Mar;130(3):179-88. doi: 10.1016/j.mad.2008.11.004. Epub 2008 Nov 21. Mech Ageing Dev. 2009. PMID: 19071156
-
Role of Nrf2 in cell senescence regulation.Mol Cell Biochem. 2021 Jan;476(1):247-259. doi: 10.1007/s11010-020-03901-9. Epub 2020 Sep 11. Mol Cell Biochem. 2021. PMID: 32918185 Review.
-
Vitamin D and systemic cancer: is this relevant to malignant melanoma?Br J Dermatol. 2002 Aug;147(2):197-213. doi: 10.1046/j.1365-2133.2002.04960.x. Br J Dermatol. 2002. PMID: 12174089 Review.
Cited by
-
Bone Formation and Maintenance in Oral Surgery: The Decisive Role of the Immune System-A Narrative Review of Mechanisms and Solutions.Bioengineering (Basel). 2024 Feb 16;11(2):191. doi: 10.3390/bioengineering11020191. Bioengineering (Basel). 2024. PMID: 38391677 Free PMC article. Review.
-
β-Cryptoxanthin Maintains Mitochondrial Function by Promoting NRF2 Nuclear Translocation to Inhibit Oxidative Stress-Induced Senescence in HK-2 Cells.Int J Mol Sci. 2023 Feb 14;24(4):3851. doi: 10.3390/ijms24043851. Int J Mol Sci. 2023. PMID: 36835262 Free PMC article.
-
Eriodictyol ameliorates cognitive dysfunction in APP/PS1 mice by inhibiting ferroptosis via vitamin D receptor-mediated Nrf2 activation.Mol Med. 2022 Jan 29;28(1):11. doi: 10.1186/s10020-022-00442-3. Mol Med. 2022. PMID: 35093024 Free PMC article.
-
p16 deficiency attenuates intervertebral disc degeneration by adjusting oxidative stress and nucleus pulposus cell cycle.Elife. 2020 Mar 3;9:e52570. doi: 10.7554/eLife.52570. Elife. 2020. PMID: 32125276 Free PMC article.
-
Efficacy of vitamin D3 supplementation on cancer mortality: Systematic review and individual patient data meta-analysis of randomised controlled trials.Ageing Res Rev. 2023 Jun;87:101923. doi: 10.1016/j.arr.2023.101923. Epub 2023 Mar 31. Ageing Res Rev. 2023. PMID: 37004841 Free PMC article.
References
-
- Bao, B. Y. , Ting, H. J. , Hsu, J. W. , & Lee, Y. F. (2008). Protective role of 1 alpha, 25‐dihydroxyvitamin D3 against oxidative stress in nonmalignant human prostate epithelial cells. International Journal of Cancer, 122, 2699–2706. - PubMed
-
- Berridge, M. J. (2015a). Vitamin D cell signalling in health and disease. Biochemical and Biophysical Research Communications, 460, 53–71. - PubMed
-
- Berridge, M. J. (2015b). Vitamin D: A custodian of cell signalling stability in health and disease. Biochemical Society Transactions, 43, 349–358. - PubMed
Publication types
MeSH terms
Substances
Grants and funding
- 2014CB942900/National Basic Research Program of China/International
- 81230009/National Natural Science Foundation of China/International
- 81730066/National Natural Science Foundation of China/International
- 81471501/National Natural Science Foundation of China/International
- 81500682/National Natural Science Foundation of China/International
LinkOut - more resources
Full Text Sources
Other Literature Sources
Medical
Molecular Biology Databases
Research Materials
Miscellaneous
