. 2020 Apr;26(4):457-467.
doi: 10.1177/1352458519833018. Epub 2019 Mar 25.

Selective inversion recovery quantitative magnetization transfer imaging: Toward a 3 T clinical application in multiple sclerosis

Affiliations

Selective inversion recovery quantitative magnetization transfer imaging: Toward a 3 T clinical application in multiple sclerosis

Francesca Bagnato et al. Mult Scler. 2020 Apr.

Abstract

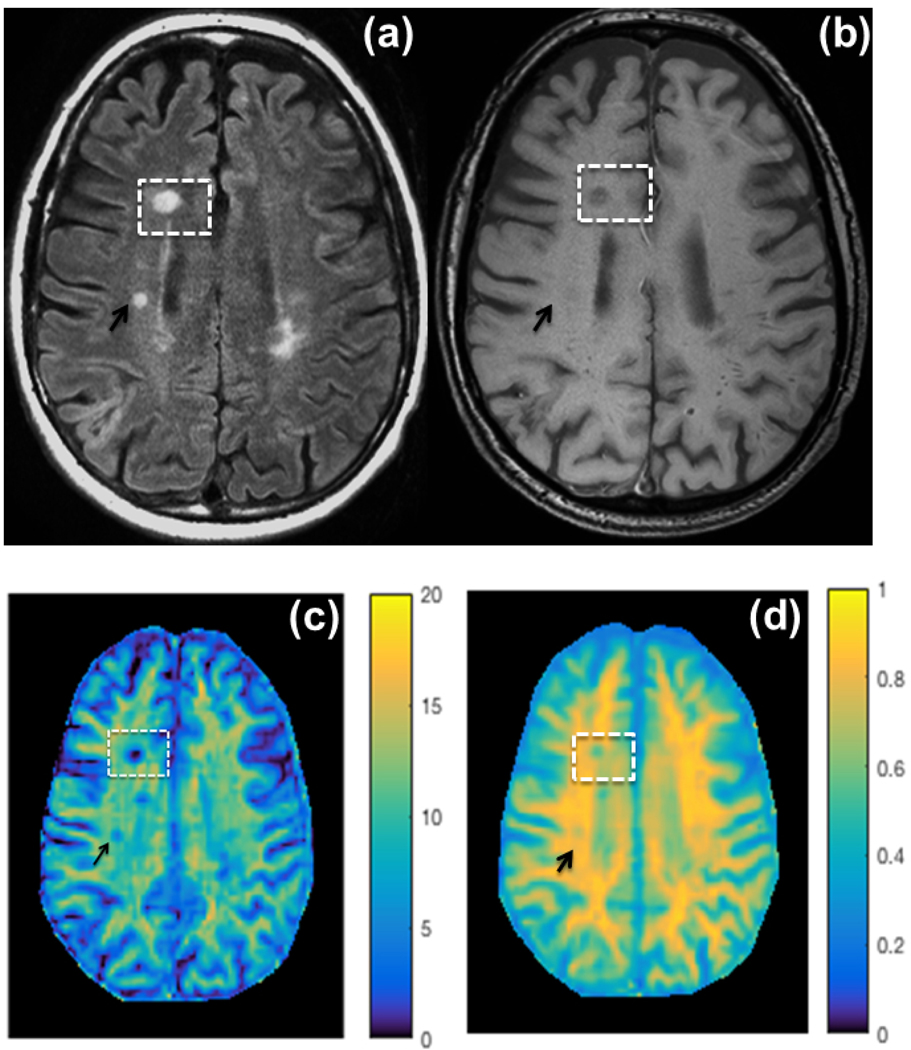
Background: Assessing the degree of myelin injury in patients with multiple sclerosis (MS) is challenging due to the lack of magnetic resonance imaging (MRI) methods specific to myelin quantity. By measuring distinct tissue parameters from a two-pool model of the magnetization transfer (MT) effect, quantitative magnetization transfer (qMT) may yield these indices. However, due to long scan times, qMT has not been translated clinically.

Objectives: We aim to assess the clinical feasibility of a recently optimized selective inversion recovery (SIR) qMT and to test the hypothesis that SIR-qMT-derived metrics are informative of radiological and clinical disease-related changes in MS.

Methods: A total of 18 MS patients and 9 age- and sex-matched healthy controls (HCs) underwent a 3.0 Tesla (3 T) brain MRI, including clinical scans and an optimized SIR-qMT protocol. Four subjects were re-scanned at a 2-week interval to determine inter-scan variability.

Results: SIR-qMT measures differed between lesional and non-lesional tissue (p < 0.0001) and between normal-appearing white matter (NAWM) of patients with more advanced disability and normal white matter (WM) of HCs (p < 0.05). SIR-qMT measures were associated with lesion volumes, disease duration, and disability scores (p ⩽ 0.002).

Conclusion: SIR-qMT at 3 T is clinically feasible and predicts both radiological and clinical disease severity in MS.

Keywords: Biomarkers; T2 lesions; demyelination; multiple sclerosis; outcome measurement.


Conflict of interest statement

None of the authors declare any conflicts of interest with this work.

Figures

Figure 1:
Figure 1:. Clinical scans and parametric maps Side by side
(a) T1-weighted turbo spin echo (T1-w TSE), (b) T2-w Fluid Attenuated Inversion Recovery (FLAIR), sequences, and color-coded (c) macromolecular to free water pool-size-ratio (PSR, %) and maps of (d) spin-lattice relaxation rate of water (R1f, seconds−1). The visibility of a non-acute black hole (BH, white rectangle) and a T2-lesion (black arrow) is highlighted on each map of this representative case.
Figure 2:
Figure 2:. Schematic representations of lesions delineation
Methodology employed for lesions identification: all T2 hyper-intense lesions were first delineated on T2-w FLAIR sequences (a, green regions of interest or ROIs); non-acute black holes (BHs) were delineated on T1-w TSE (b, yellow ROIs). Thereafter, a subtraction mask was created to ensure that lesions counted as T2-lesions did not include BHs (c, blue ROIs). These generated T2-lesions (blue ROIs) and BHs (yellow ROIs) masks were then overlaid on PSR (d) and R1f (e) parametric maps and correspondent quantities derived.
Figure 3:
Figure 3:. PSR and R1f values of brain regions with different tissue composition
Comparisons in PSR and R1f values measured in different tissue types. Fig.3a-b compares PSR (a) and R1f (b) between non-acute BHs (stripped bars) and T2-lesions (white bars). Fig.3c-d compares PSR (c) and R1f (d) between T2-lesions (stripped bars) and normal appearing white matter (NAWM, white bars). Fig.3e-f compares PSR (e) and R1f (f) between NAWM in patients (stripped bars) and normal WM (NWM) in healthy controls (white bars). The graphs display mean (bars) and standard deviations.
Figure 4.
Figure 4.. Histogram analysis PSR
(a) and R1f (b) NWM (black) and NAWM histograms of patients with Expanded Disability Status Scale (EDSS) score≤1 (red) and EDSS>1 (blue). The solid dark line represents the mean values and the shaded region the mean±standard error.
Figure 5:
Figure 5:. Correlations between imaging and clinical measures
Plots depicting the most clinically relevant and statistically significant associations seen between clinical / MRI (T2-lesions and BHs volumes) variables and SIR-qMT metrics. One can note the presence of an outlier patient in fig. 5e. We present the output of the correlation obtained with (p- and r-values in black) and without (p- and r-values in gray) the presence of this outlier subject. From this analysis, it can be seen that similar correlations coefficients were obtained with and without the inclusion of this outlier patient, although the p-value of the association was smaller when the outlier outlier subject was excluded.

References

    1. Mahad DH, Trapp BD, Lassmann H. Pathological mechanisms in progressive multiple sclerosis. Lancet Neurol 2015; 14: 183–193. - PubMed
    1. Fox RJ, Thompson A, Baker D, et al. Setting a research agenda for progressive multiple sclerosis: the international collaborative on progressive MS. Mult Scler 2012; 18: 1534–1540. - PMC - PubMed
    1. Wolff SD, Balaban RS. Magnetization transfer contrast (MTC) and tissue water proton relaxation in vivo. Magn Reson Med 1989; 10: 135–144. - PubMed
    1. Laule C, Vavasour IM, Kolind SH, et al. Magnetic resonance imaging of myelin. Neurotherapeutics 2007; 4: 460–484. - PMC - PubMed
    1. Berry I, Barker GJ, Barkhof F, et al. A multicenter measurement of magnetization transfer ratio in normal white matter. J Magn Reson Imaging 1999; 9: 441–446. - PubMed

Publication types