Review
. 2019 Apr;18(8):784-794.
doi: 10.1080/15384101.2019.1598725. Epub 2019 Mar 30.

Dynamics of protein synthesis and degradation through the cell cycle

Affiliations
Review

Dynamics of protein synthesis and degradation through the cell cycle

Andrea Brigitta Alber et al. Cell Cycle. 2019 Apr.

Abstract

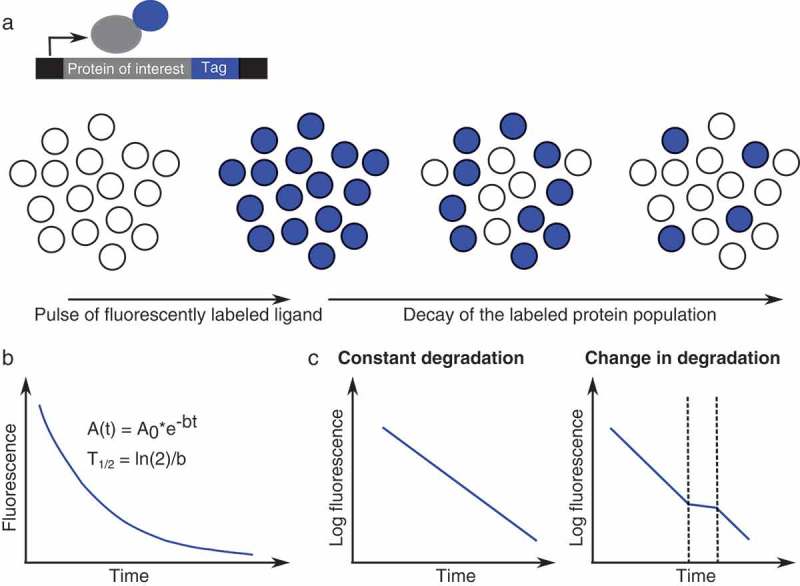
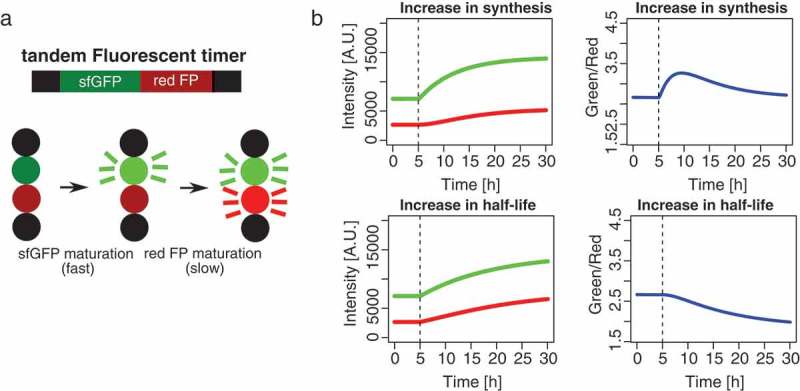
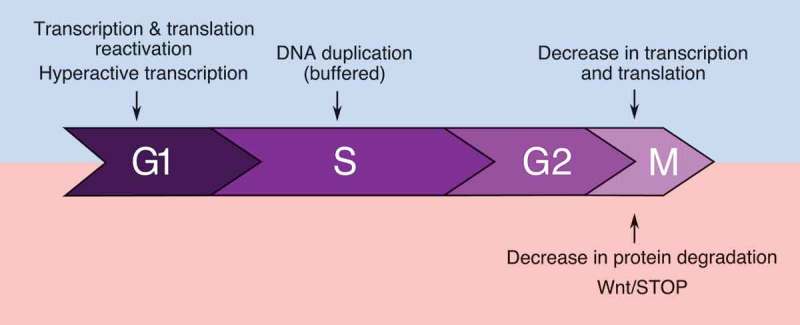
Protein expression levels depend on the balance between their synthesis and degradation rates. Even quiescent (G0) cells display a continuous turnover of proteins, despite protein levels remaining largely constant over time. In cycling cells, global protein levels need to be precisely doubled at each cell division in order to maintain cellular homeostasis, but we still lack a quantitative understanding of how this is achieved. Recent studies have shed light on cell cycle-dependent changes in protein synthesis and degradation rates. Here we discuss current population-based and single cell approaches used to assess protein synthesis and degradation, and review the insights they have provided into the dynamics of protein turnover in different cell cycle phases.

Keywords: Protein synthesis; cell cycle; population-based studies; protein degradation; single cell approaches.


Figures

Figure 1.
Figure 1.
Fluorescently labeled protein tags to monitor protein degradation. (a): A protein of interest is fused to a SNAP/Halo/Clip-tag, which can be pulse-labeled with a fluorescent ligand. Upon washing of the residual dye, the decay of the labeled protein population can be observed. (b): Protein degradation follows an exponential decay. A0: Initial fluorescence intensity, b: decay rate, T1/2: half-life. (c): Schematic representation of how SNAP/Halo/Clip-tags can be used to identify changes in protein degradation.
Figure 2.
Figure 2.
Tandem fluorescent timers allow to simultaneously monitor protein synthesis and degradation. (a): Upon production of the fusion protein, superfolder GFP (sfGFP), matures fast, whereas the red fluorescent protein (FP) matures more slowly. (b): Simulations showing how tandem fluorescent timers can be used to distinguish changes in protein synthesis from changes in protein degradation. Figure reused from [38], Figure 1(d), with permission from Molecular Cell (License number: 4472970734996).
Figure 3.
Figure 3.
Summary of currently known global changes in protein synthesis (blue) and degradation (red) over the cell cycle.

References

    1. Milo R, Phillips R.. Cell biology by the numbers. New York (NY): Garland Science, Taylor & Francis Group; 2016.
    1. Powers ET, Morimoto RI, Dillin A, et al. Biological and chemical approaches to diseases of proteostasis deficiency. Annu Rev Biochem. 2009;78:959–991. - PubMed
    1. Prabakaran S, Lippens G, Steen H, et al. Post-translational modification: nature’s escape from genetic imprisonment and the basis for dynamic information encoding. Wiley Interdiscip Rev Syst Biol Med. 2012;4:565–583. - PMC - PubMed
    1. Cooper GM. The cell: a molecular approach. 2. ed. Washington (DC): ASM Press [u.a.]; 2000.
    1. Belle A, Tanay A, Bitincka L, et al. Quantification of protein half-lives in the budding yeast proteome. Proc Natl Acad Sci U S A. 2006;103:13004–13009. - PMC - PubMed

Publication types

LinkOut - more resources