Racial Segregation and Inequality in the Neonatal Intensive Care Unit for Very Low-Birth-Weight and Very Preterm Infants
- PMID: 30907924
- PMCID: PMC6503514
- DOI: 10.1001/jamapediatrics.2019.0241
Racial Segregation and Inequality in the Neonatal Intensive Care Unit for Very Low-Birth-Weight and Very Preterm Infants
Abstract
Importance: Racial and ethnic minorities receive lower-quality health care than white non-Hispanic individuals in the United States. Where minority infants receive care and the role that may play in the quality of care received is unclear.
Objective: To determine the extent of segregation and inequality of care of very low-birth-weight and very preterm infants across neonatal intensive care units (NICUs) in the United States.
Design, setting, and participants: This cohort study of 743 NICUs in the Vermont Oxford Network included 117 982 black, Hispanic, Asian, and white infants born at 401 g to 1500 g or 22 to 29 weeks' gestation from January 2014 to December 2016. Analysis began January 2018.
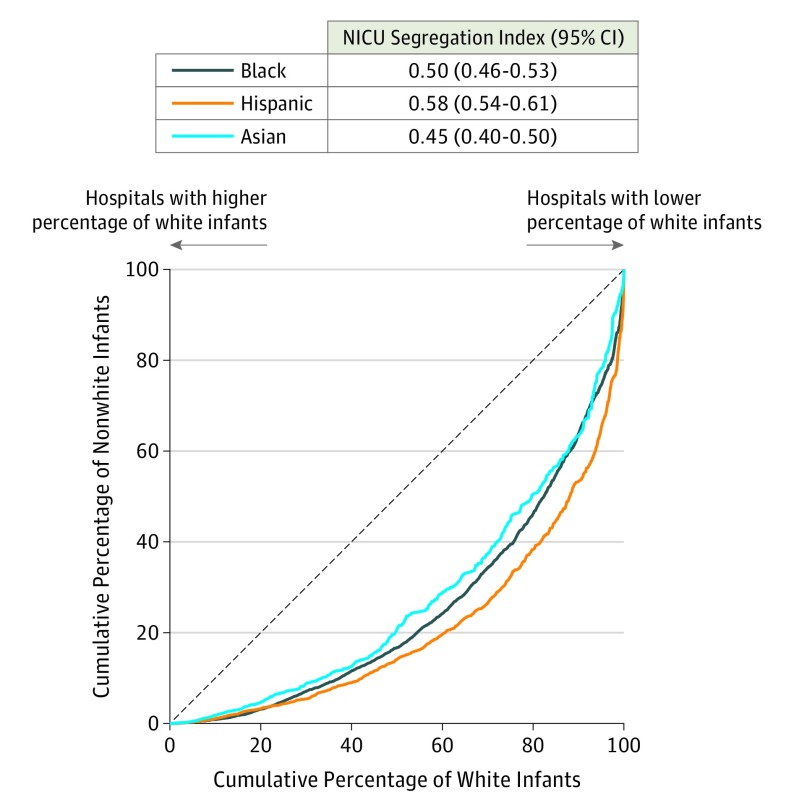
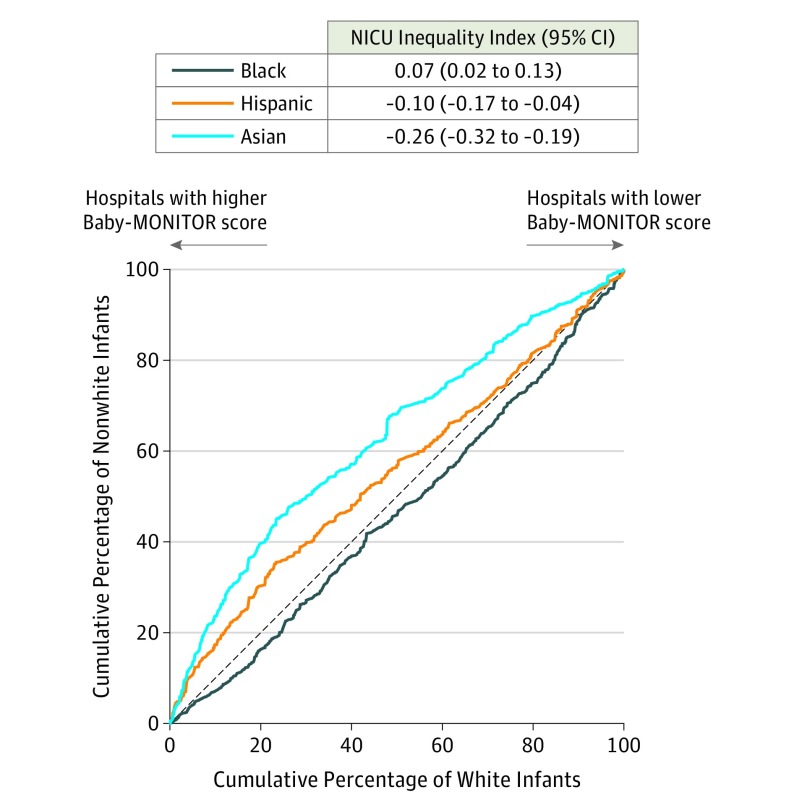
Main outcomes and measures: The NICU segregation index and NICU inequality index were calculated at the hospital level as the Gini coefficients associated with the Lorenz curves for black, Hispanic, and Asian infants compared with white infants, with NICUs ranked by proportion of white infants for the NICU segregation index and by composite Baby-MONITOR (Measure of Neonatal Intensive Care Outcomes Research) score for the NICU inequality index.
Results: Infants (36 359 black [31%], 21 808 Hispanic [18%], 5920 Asian [5%], and 53 895 white [46%]) were segregated among the 743 NICUs by race and ethnicity (NICU segregation index: black: 0.50 [95% CI, 0.46-0.53], Hispanic: 0.58 [95% CI, 0.54-0.61], and Asian: 0.45 [95% CI, 0.40-0.50]). Compared with white infants, black infants were concentrated at NICUs with lower-quality scores, and Hispanic and Asian infants were concentrated at NICUs with higher-quality scores (NICU inequality index: black: 0.07 [95% CI, 0.02-0.13], Hispanic: -0.10 [95% CI, -0.17 to -0.04], and Asian: -0.26 [95% CI, -0.32 to -0.19]). There was marked variation among the census regions in weighted mean NICU quality scores (range: -0.69 to 0.85). Region of residence explained the observed inequality for Hispanic infants but not for black or Asian infants.
Conclusions and relevance: Black, Hispanic, and Asian infants were segregated across NICUs, reflecting the racial segregation of minority populations in the United States. There were large differences between geographic regions in NICU quality. After accounting for these differences, compared with white infants, Asian infants received care at higher-quality NICUs and black infants, at lower-quality NICUs. Explaining these patterns will require understanding the effects of sociodemographic factors and public policies on hospital quality, access, and choice for minority women and their infants.
Conflict of interest statement
Figures
Comment in
-
Racial Segregation and Inequality of Care in Neonatal Intensive Care Units Is Unacceptable.JAMA Pediatr. 2019 May 1;173(5):420-421. doi: 10.1001/jamapediatrics.2019.0240. JAMA Pediatr. 2019. PMID: 30907946 No abstract available.
References
-
- Massey DS, Denton NA. American Apartheid: Segregation and Making of the Underclass. Cambridge, MA: Harvard University Press; 1998.
-
- Kozol J. Savage Inequalities: Children in America’s Schools. New York, NY: Broadway Paperbacks; 1991.
-
- Rivkin S. Desegregation since the Coleman Report. Educ Next. 2016;16(2):28-37.