Standardized Assessment of Automatic Segmentation of White Matter Hyperintensities and Results of the WMH Segmentation Challenge
- PMID: 30908194
- PMCID: PMC7590957
- DOI: 10.1109/TMI.2019.2905770
Standardized Assessment of Automatic Segmentation of White Matter Hyperintensities and Results of the WMH Segmentation Challenge
Abstract
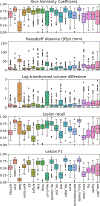
Quantification of cerebral white matter hyperintensities (WMH) of presumed vascular origin is of key importance in many neurological research studies. Currently, measurements are often still obtained from manual segmentations on brain MR images, which is a laborious procedure. The automatic WMH segmentation methods exist, but a standardized comparison of the performance of such methods is lacking. We organized a scientific challenge, in which developers could evaluate their methods on a standardized multi-center/-scanner image dataset, giving an objective comparison: the WMH Segmentation Challenge. Sixty T1 + FLAIR images from three MR scanners were released with the manual WMH segmentations for training. A test set of 110 images from five MR scanners was used for evaluation. The segmentation methods had to be containerized and submitted to the challenge organizers. Five evaluation metrics were used to rank the methods: 1) Dice similarity coefficient; 2) modified Hausdorff distance (95th percentile); 3) absolute log-transformed volume difference; 4) sensitivity for detecting individual lesions; and 5) F1-score for individual lesions. In addition, the methods were ranked on their inter-scanner robustness; 20 participants submitted their methods for evaluation. This paper provides a detailed analysis of the results. In brief, there is a cluster of four methods that rank significantly better than the other methods, with one clear winner. The inter-scanner robustness ranking shows that not all the methods generalize to unseen scanners. The challenge remains open for future submissions and provides a public platform for method evaluation.
Figures


References
-
- Pantoni L, “Cerebral small vessel disease: from pathogenesis and clinical characteristics to therapeutic challenges,” The Lancet Neurology, vol. 9, no. 7, pp. 689–701, 2010. - PubMed
-
- Prins ND and Scheltens P, “White matter hyperintensities, cognitive impairment and dementia: an update,” Nature Reviews Neurology, vol. 11, no. 3, pp. 157–165, 2015. - PubMed
-
- Wardlaw JM, Smith EE, Biessels GJ, Cordonnier C, Fazekas F, Frayne R, Lindley RI, O’Brien JT, Barkhof F, Benavente OR, Black SE, Brayne C, Breteler M, Chabriat H, Decarli C, de Leeuw F-E, Doubal F, Duering M, Fox NC, Greenberg S, Hachinski V, Kilimann I, Mok V, van Oostenbrugge R, Pantoni L, Speck O, Stephan BCM, Teipel S, Viswanathan A, Werring D, Chen C, Smith C, van Buchem M, Norrving B, Gorelick PB, and Dichgans M, “Neuroimaging standards for research into small vessel disease and its contribution to ageing and neurodegeneration.” The Lancet. Neurology, vol. 12, no. 8, pp. 822–38, 2013. - PMC - PubMed
-
- Biesbroek JM, Weaver NA, and Biessels GJ, “Lesion location and cognitive impact of cerebral small vessel disease,” Clinical Science, vol. 131, no. 8, pp. 715–728, 2017. - PubMed
Publication types
MeSH terms
Grants and funding
LinkOut - more resources
Full Text Sources
Medical

