. 2019 Mar 25;17(3):e2007032.
doi: 10.1371/journal.pbio.2007032. eCollection 2019 Mar.

Performing group-level functional image analyses based on homologous functional regions mapped in individuals

Affiliations

Performing group-level functional image analyses based on homologous functional regions mapped in individuals

Meiling Li et al. PLoS Biol. .

Abstract

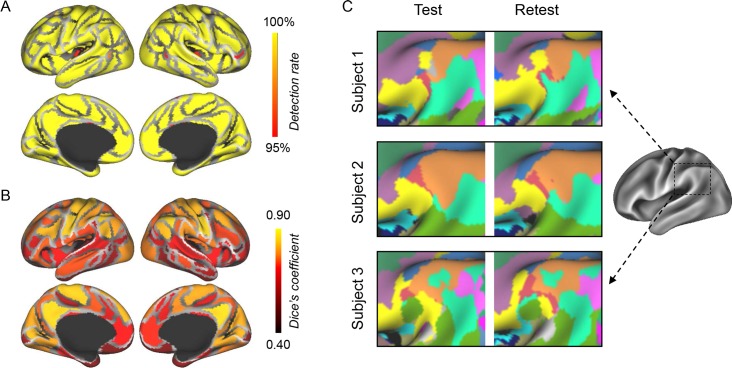
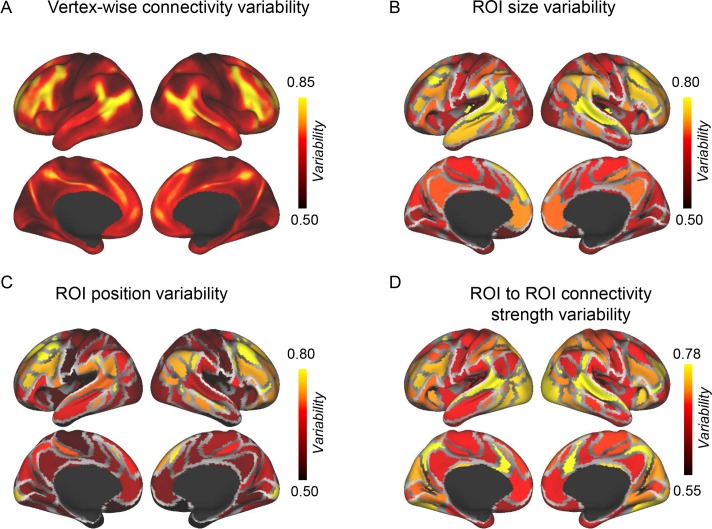
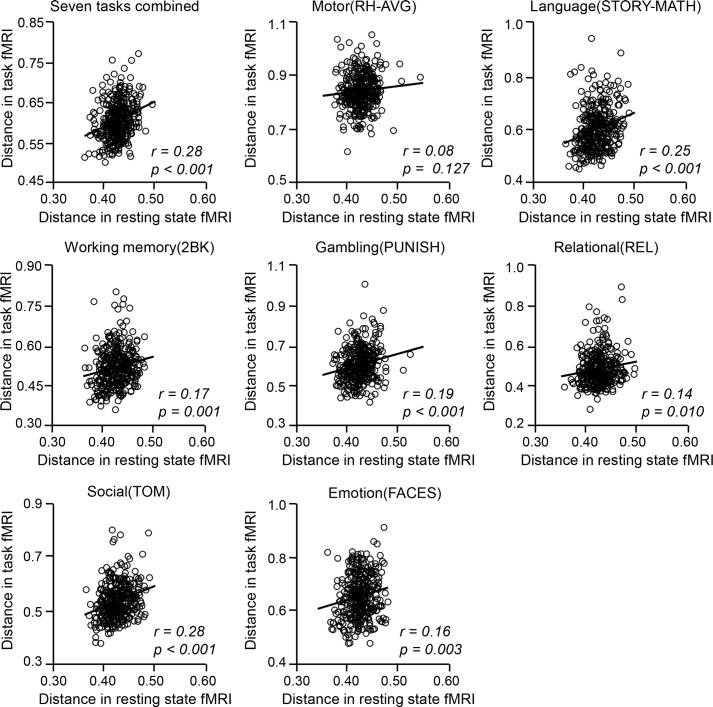
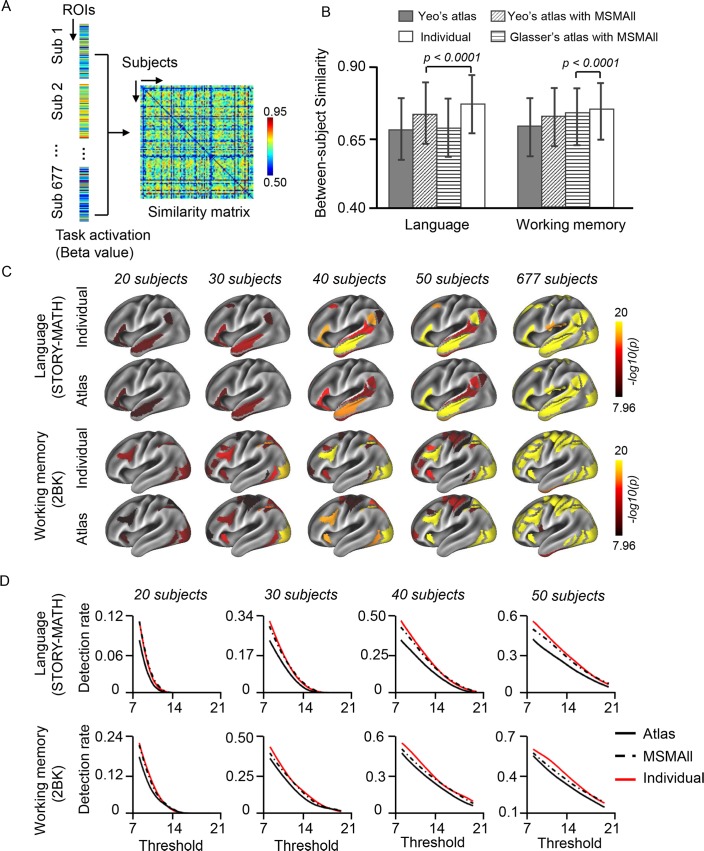
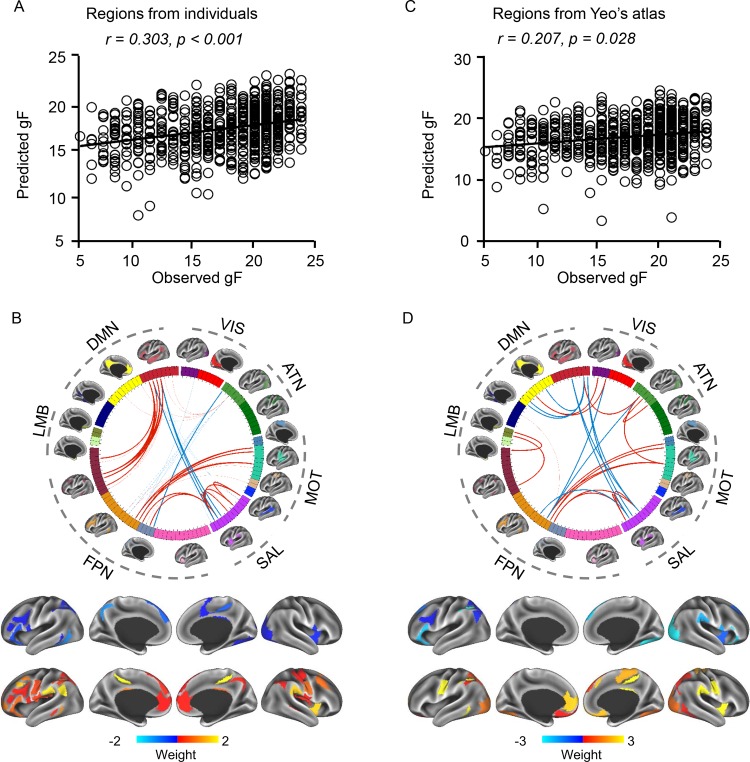
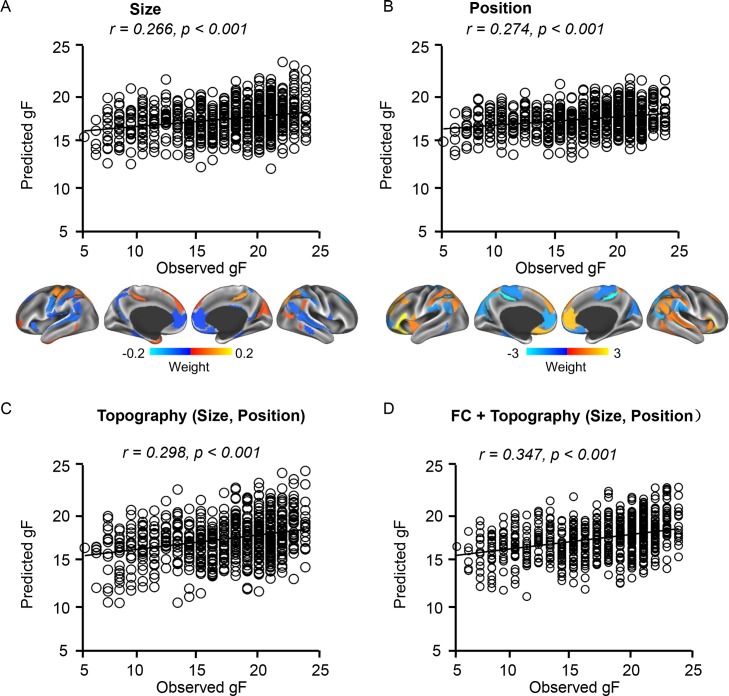
Functional MRI (fMRI) studies have traditionally relied on intersubject normalization based on global brain morphology, which cannot establish proper functional correspondence between subjects due to substantial intersubject variability in functional organization. Here, we reliably identified a set of discrete, homologous functional regions in individuals to improve intersubject alignment of fMRI data. These functional regions demonstrated marked intersubject variability in size, position, and connectivity. We found that previously reported intersubject variability in functional connectivity maps could be partially explained by variability in size and position of the functional regions. Importantly, individual differences in network topography are associated with individual differences in task-evoked activations, suggesting that these individually specified regions may serve as the "localizer" to improve the alignment of task-fMRI data. We demonstrated that aligning task-fMRI data using the regions derived from resting state fMRI may lead to increased statistical power of task-fMRI analyses. In addition, resting state functional connectivity among these homologous regions is able to capture the idiosyncrasies of subjects and better predict fluid intelligence (gF) than connectivity measures derived from group-level brain atlases. Critically, we showed that not only the connectivity but also the size and position of functional regions are related to human behavior. Collectively, these findings suggest that identifying homologous functional regions across individuals can benefit a wide range of studies in the investigation of connectivity, task activation, and brain-behavior associations.


Conflict of interest statement

The authors have declared that no competing interests exist.

Figures

Fig 1
Fig 1. Homologous functional ROIs can be identified across subjects.
(A) Most of the 116 functional ROIs originally defined in the group-level atlas can be identified in individual subjects. The map demonstrates the percentage of the 677 subjects in whom a functional ROI could be detected. A few ROIs that were not identified in all subjects tended to be smaller in size (shown in red and orange). (B) Within-subject test-retest reliability values of the 116 functional ROIs. The test-retest reliability of each ROI was measured as the Dice’s coefficient of the results derived from the two scan sessions of each subject and then averaged across the 677 subjects. For each subject, if a region was undetected in one session, then the Dice’s coefficient of this region was set to zero. The mean Dice’s coefficient across the 116 ROIs was 69.8% ± 12.9% (mean ± SD). (C) ROIs in the TPJ extracted from three randomly selected subjects are illustrated as examples. The TPJ region is shown because it consists of multiple small patches belonging to different functional networks. The ROIs were reliably identified across different scan sessions. Different ROIs are represented by different colors. ROI, region of interest; TPJ, temporal-parietal junction.
Fig 2
Fig 2. Intersubject variability in vertex-wise functional connectivity maps is associated with intersubject variability in the position of the functional regions.
(A) Intersubject variability in resting state functional connectivity was quantified at each vertex using the approach as described in Mueller and colleagues [5]. The association cortices showed stronger intersubject variability than the visual and motor-sensory cortices. (B) Intersubject variability in ROI size was quantified for each of the 116 ROIs, and the variability map showed a moderate correlation (r = 0.26) with the variability in vertex-wise connectivity. (C) Intersubject variability in ROI position was quantified for each ROI and showed a strong correlation (r = 0.49) with the variability in vertex-wise connectivity. (D) Intersubject variability in connectivity among individually specified ROIs was quantified and showed a strong correlation (r = 0.55) with the variability in vertex-wise connectivity (also see S2 Fig for the scatterplots). The visual and auditory cortices demonstrated unexpectedly strong intersubject variability in connectivity with other ROIs. All intersubject variability maps were corrected by underlying intrasubject variability (see Materials and methods). ROI, region of interest.
Fig 3
Fig 3. Intersubject variability in cortical functional anatomy is associated with intersubject variability in task-evoked activations.
Intersubject variability in cortical functional anatomy was computed as the “distance” between two subjects’ functional ROI distributions (i.e., 1—Dice’s coefficient). Similarly, intersubject variability in task-evoked activations was measured as the “distance” between two subjects’ cortical activation patterns (i.e., 1—spatial correlation between the two maps). Intersubject variability in cortical functional anatomy showed significant correlations with intersubject variability in task activation maps for 6 tasks except for the motor task (r values are displayed in each plot, Pearson’s correlation). Each circle represents the “distance” between a pair of subjects; 338 independent pairs of subjects were randomly selected 99 times and the scatterplot of the median performance (correlation) is shown. See S1 Data for numerical values. fMRI, functional MRI.
Fig 4
Fig 4. Aligning functional regions across individual subjects improves group-level task-fMRI analyses.
(A) Similarity of task activations between pairs of subjects. For each subject, task activation values (beta values) were averaged within each ROI; thus, the whole-brain activation pattern was represented by activations in ROIs. Similarity between two subjects was estimated by correlating their activation pattern in these ROIs. (B) The bar plots demonstrate the mean between-subject similarity values during the language and working memory tasks estimated by different approaches. Task activation patterns were more similar between two subjects if the ROIs were individually specified compared with atlas based (whether or not the data were aligned by MSMAll) (*p < 0.001, block bootstrap test, 1,000 permutations). Error bars indicate 2 standard deviations. See S3 Fig for the results of other tasks. (C) Group-level statistical analyses were performed in the individually specified ROIs and atlas-based ROIs using the mean activation (beta values) within each ROI (one-sample t test, p < 0.000001 for language and working memory tasks, Bonferroni correction for 92 comparisons). Results of the language and working memory tasks in subsets of the cohort (n = 20, 30, 40, 50) and in the full cohort were plotted (see S3 Fig for the results of other tasks). (D) Task-relevant regions could be better detected using the individually specified ROIs than using the atlas-based ROIs, independent of the selection of a significance threshold. Group-level task-activated regions were mapped using a series of significance thresholds. The results were then compared with the task-activated regions identified in the full cohort to determine the detection rate. The detection rate was higher for individually specified ROIs (red curves) than atlas-based ROIs (black curves). The MSMAll (dashed curves) improved the task activation but not as much as the individual ROIs. See S1 Data for numerical values. fMRI, functional MRI; MSM, multimodal surface matching; ROI, region of interest; Sub, subject.
Fig 5
Fig 5. Functional connectivity among the individually specified ROIs can better predict gF than connectivity among the atlas-based ROIs.
(A) gF was predicted based on connectivity values among the individually specified ROIs. The scatterplot demonstrates the correlation between the predicted and observed gF scores (Pearson’s correlation, r = 0.303, p < 0.001). Each circle represents a subject. Correlation significance was determined using 1,000 permutations. (B) ROI pairs contributing to the prediction. Ninety-two homologous ROIs extracted from the 18 networks are represented by rectangles on a wheel. ROIs are color coded according to the 18 networks. Group-level maps of the 18 functional networks are shown on the cortical surface outside the wheel. ROIs derived from the 18 networks could be grouped according to 7 well-studied canonical networks. The 25 ROI pairs that are most predictive of gF are indicated by thick lines in the wheel. Connections positively correlated with gF scores are shown in red, and connections negatively correlated with gF scores are shown in blue. Regions involved in these predictive connections are also plotted on the brain surface (bottom row). Warm colors indicate positive correlations between connectivity and gF. Cold colors indicate negative correlations between connectivity and gF. (C) The correlation between the predicted and observed gF scores was weaker (p = 0.002, z = 2.849, Steiger’s z test) when connectivity was estimated using the atlas-based ROIs (Pearson’s correlation, r = 0.207, p = 0.028). Correlation significance was determined using 1,000 permutations. (D) Twenty-six atlas-based ROI pairs that are most predictive of gF are plotted. See S1 Data for numerical values. ATN, attention; DMN, default mode network; FPN, frontoparietal network; gF, fluid intelligence; LMB, limbic; MOT, motor-sensory network; ROI, region of interest; SAL, salience network; VIS, visual.
Fig 6
Fig 6. Topography of individually specified ROIs can predict gF.
(A) Size of brain regions can predict gF. Regions with prediction weight values above the global mean were mapped on the surface. Warm colors indicated regions whose size showed positive correlations with gF scores. Cold colors indicated regions whose size showed negative correlations with gF scores. (B) Position of brain regions can predict gF. Brain regions whose coordinates on the anterior-posterior axis could predict gF were plotted on the brain surface. Warm color indicates that more anterior position is related to higher gF. Cold color indicates that more posterior position is related to higher gF. (C, D) Combining topography and functional connectivity features can improve the prediction of gF. See S1 Data for numerical values. gF, fluid intelligence; ROI, region of interest.

References

    1. Evans AC, Collins DL, Mills SR, Brown ED, Kelly R, Peters TM, editors. 3D statistical neuroanatomical models from 305 MRI volumes. 1993 IEEE Conference Record Nuclear Science Symposium and Medical Imaging Conference; 1993 31 Oct-6 Nov 1993.
    1. Amunts K, Kedo O, Kindler M, Pieperhoff P, Mohlberg H, Shah NJ, et al. Cytoarchitectonic mapping of the human amygdala, hippocampal region and entorhinal cortex: intersubject variability and probability maps. Anatomy and Embryology. 2005;210(5):343–52. - PubMed
    1. Hill J, Dierker D, Neil J, Inder T, Knutsen A, Harwell J, et al. A surface-based analysis of hemispheric asymmetries and folding of cerebral cortex in term-born human infants. J Neurosci. 2010;30(6):2268–76. 10.1523/JNEUROSCI.4682-09.2010 - DOI - PMC - PubMed
    1. Amunts K, Schleicher A, Burgel U, Mohlberg H, Uylings HB, Zilles K. Broca's region revisited: cytoarchitecture and intersubject variability. J Comp Neurol. 1999;412(2):319–41. - PubMed
    1. Mueller S, Wang D, Fox MD, Thomas Yeo BT, Sepulcre J, Sabuncu MR, et al. Individual Variability in Functional Connectivity Architecture of the Human Brain. Neuron. 2013;77(3):586–95. 10.1016/j.neuron.2012.12.028 - DOI - PMC - PubMed

Publication types