. 2019 Mar 25;14(3):e0214093.
doi: 10.1371/journal.pone.0214093. eCollection 2019.

A pilot study showing that repeated exposure to stress produces alterations in subsequent responses to anesthetics in rats

Affiliations

A pilot study showing that repeated exposure to stress produces alterations in subsequent responses to anesthetics in rats

Lingzhi Wang et al. PLoS One. .

Abstract

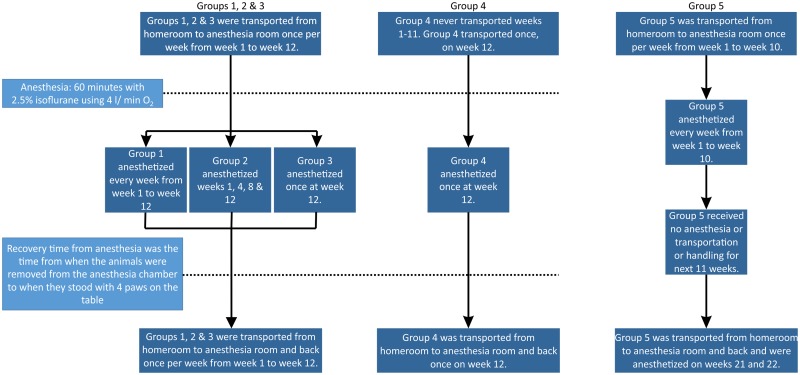
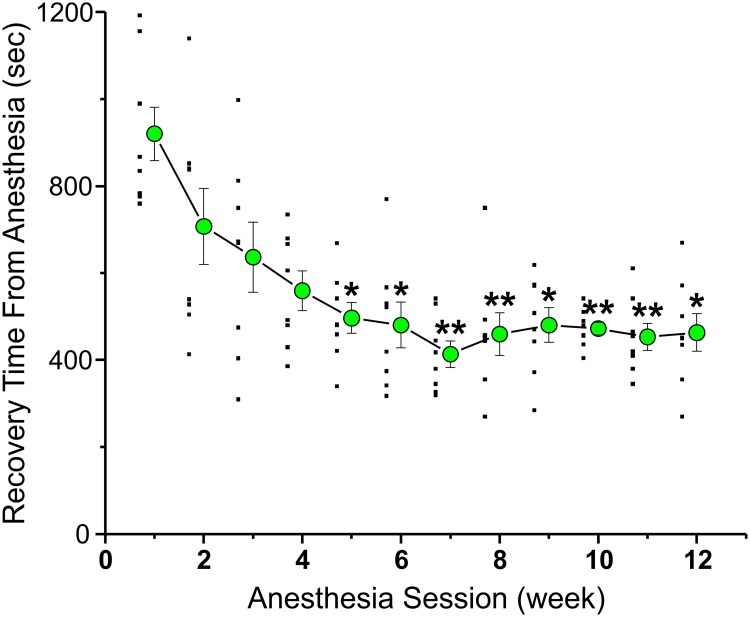
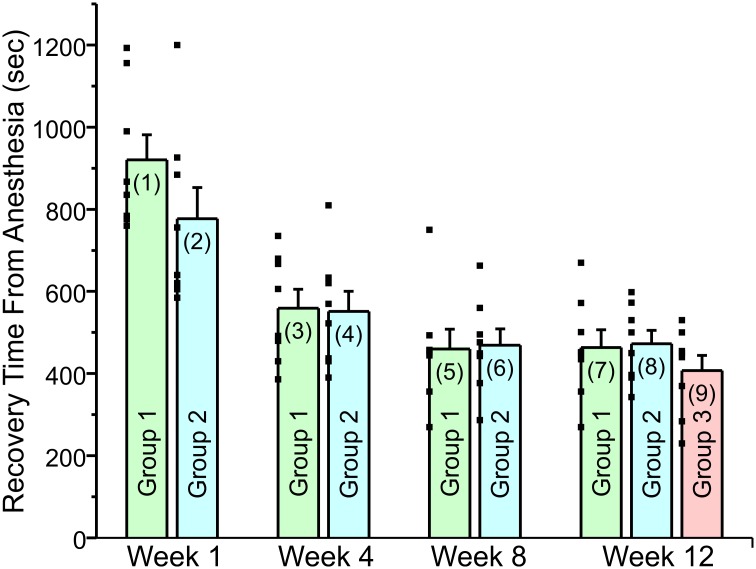
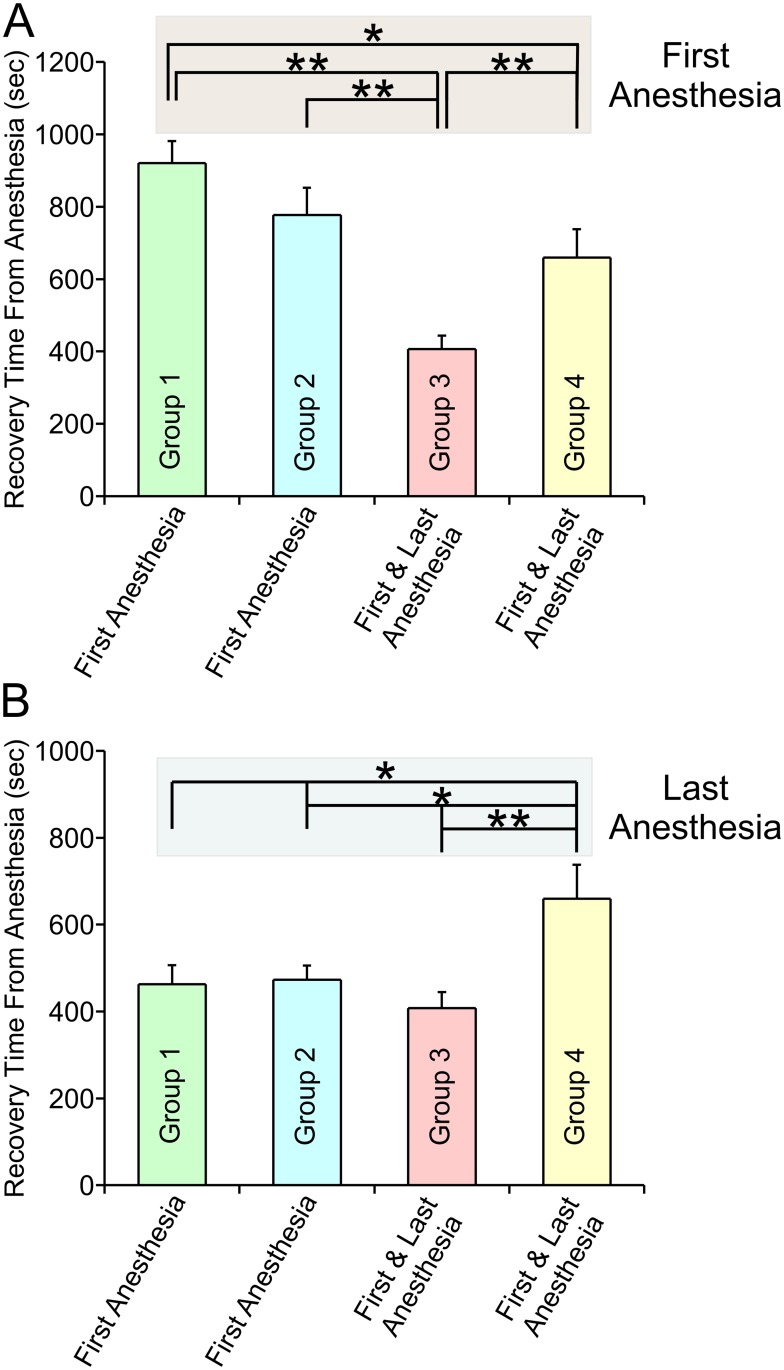
The repeated use of a drug frequently leads to alterations in the response to that drug. We undertook this study to determine whether multiple exposures to the general anesthetic produced alterations in subsequent exposures to this anesthetic. For this study, adult male rats were anesthetized with 2.5% isoflurane for one hour. The rats were divided into 4 groups of 8 rats each. Groups 1-3 were transported between their homeroom and the anesthesia testing room and were handled in an identical manner weekly for a period of 12 weeks, but were anesthetized on different schedules. Group 1 was anesthetized weekly for 12 weeks, Group 2 on either a 3 or 4 week schedule and Group 3 was anesthetized a single time, at the end of the 12 week period. To receive anesthesia multiple times, animals were transported from their homeroom to the anesthesia location and handled repeatedly. We took into consideration of the frequency of anesthesia exposure and the stress involved. Rats in groups 2 and 3 were placed in the anesthesia chamber, with O2 but with no anesthetic, every week when they were not scheduled to receive anesthesia. In Group 4, rats were not transported or handled in any way and stayed in the home room for a period of 12 weeks. Rats in this group were anesthetized once, at the very end of the study. Recovery of the rat's righting reflex was used to assess the acceleration of recovery time from general anesthesia. Group 1 rats showed dramatically faster emergence from anesthesia after several rounds of anesthesia. Surprisingly, Groups 2 and 3 rats, treated in an identical manner as Group 1, but which were anesthetized on different schedules, also exhibited more rapid emergence from anesthesia, when compared to Group 4 rats, which were never handled or transported prior to a single anesthesia. These results suggest that the stress of transportation and handling altered responsiveness to anesthesia. Our results show that responsiveness to anesthetic agents can change over time outside of the normal developmental changes taking place in rats as they age.


Conflict of interest statement

The authors have declared that no competing interests exist.

Figures

Fig 1
Fig 1. Description of experimental protocol.
Flow chart describing handling and anesthesia schedule for the 5 groups of rats tested in Figs 2–5. Each group had 8 rats (n = 8 each).
Fig 2
Fig 2. Decreased recovery times were observed after repeated handling and anesthesia sessions.
A cohort of 8 adult rats was anesthetized once a week, for 12 weeks, with 2.5% isoflurane (4 L/min O2) for 1 hour in an anesthesia machine. The figure plots the average time it took for the rats to emerge from anesthesia (large filled green circles), every week. Each average from weeks 2–12 was compared to that obtained in week 1, using a repeated measure ANOVA. The “*” corresponds to a significant difference in the average values, p <0.05. The “**” denotes p<0.01. The raw data is plotted just to the left of each average as small filled black squares.
Fig 3
Fig 3. Weekly anesthesia or anesthesia on a 3 or 4 week schedule had similar effect on recovery time from isoflurane anesthesia as long as the rats were handled and transported on a weekly basis.
This was also true for rats that were anesthetized once, at week 12. The figure plots the recovery time from anesthesia for the rats receiving weekly anesthesia, anesthesia on a 3–4 week schedule or receiving anesthesia once at week 12. The individual recovery times are plotted as small filled squares to the left side of each bar. All three groups were handled and transported every week. The figure shows the same time course for acceleration of recovery from anesthesia, without regard to whether the animals were anesthetized or not. Weekly anesthesia rats (Group 1) received isoflurane anesthesia once per week until week 12. Rats anesthetized on either a 3 or 4 week schedule, (Group 2) received isoflurane anesthesia at week 1, 4, 8 and 12. The rats in Group 3 were transported and handled in an identical manner to weekly rats and were anesthetized once at the very end of the study (week 12 Each data bar is labeled with a number in parenthesis. Recovery time, in seconds, for Group 1 on Week 1 is shown in Bar (1): Mean = 920 ± 61.2 (SEM). Bar (2): Mean = 777 ± 75.9. Bar (3): Mean = 559.5 ± 45.7. Bar (4): Mean = 551.6 ± 48.8. Bar (5): Mean = 459.5 ± 48.6. Bar (6): Mean = 468.8 ± 39.9. Bar (7): Mean = 463.3 ± 43.5. Bar (8): Mean = 472.6 ± 32.6. Bar (9): Mean = 407.4 ± 37. A paired T-test was used to compare data within groups while an independent T-test was used to compare data between groups. All comparisons can be found in Table 1. (1) vs (2) compares the significance of the difference between the data plotted in bar (1) vs bar (2). (1) vs (3) compares the significance of the difference between the data plotted in bar (1) and bar (3) etc. There are discrepancies in P value for Group 1 in Fig 2 and Fig 3 because repeated measure ANOVA and paired T-test were used respectively.
Fig 4
Fig 4. Comparison of the recovery times from both the first and last anesthesia sessions for Groups 1–4 shows that rats that were never transported or handled previously recovered slowly from anesthesia while rats that had been transported and handled recovered quickly.
A, Plots the mean recovery time for all 4 groups on their first anesthesia sessions. Group 1 rats (green bars) were transported every week for 12 weeks and were anesthetized each time. Plotted is the mean recovery time from the week 1 anesthesia session (week 1: Mean = 920 ± 61.2 (SEM)). Group 2 rats (cyan bars) were transported every week for 12 weeks but were anesthetized 4 times, at weeks 1, 4, 8 and 12. Plotted is the mean recovery time from the week 1 anesthesia session (week 1: Mean = 777 ± 75.9). Group 3 rats (pink bar) were transported every week for 12 weeks but were anesthetized once, at week 12. Plotted is the mean recovery time from the week 12 anesthesia (week 12: Mean = 407.4 ± 37). Group 4 rats (yellow bar) were never transported until week 12, when they were transported and anesthetized once. Plotted is the mean recovery time from the week 12 anesthesia (week 12: Mean = 659.6 ± 78.2). B, Plots the mean recovery time for all 4 groups on their last anesthesia sessions. Group 1: Mean = 463.3 ± 43.5. Group 2: Mean = 472.6 ± 32.6. Group 3: Mean = 407.4 ± 37. Group 4: Mean = 659.6 ± 78.2. Note that for Groups 3 and Group 4 which received a single round of anesthesia, the first and last anesthesia session are the same. Raw data: The individual recovery times for Groups 1, 2 and 3 at week 1 and week 12 are plotted in Fig 3 as small filled black squares. For group 4 the recovery times (in sec) at week 12 are: 557, 974, 525, 687, 754, 449, 382 and 949. A paired T-test was used to compare data within groups while an independent T-test was used to compare data between groups. All comparisons can be found in the Tables 2 and 3.
Fig 5
Fig 5. The acceleration in emergence from anesthesia was maintained even after an 11 week hiatus where rats were not transported or handled in any manner.
This group of 8 rats was anesthetized with 3% isoflurane for 60 minutes (4 L/ min O2), ten times (weeks 1–10). At that time the animals were left untouched for the following 11 weeks (hiatus). Plotted are the average recovery times observed at week 10 (504 ± 32.4), prior to the hiatus and at week 21 after the 11 week hiatus (560.9 ± 84.6). Recovery times were not different after the hiatus when compared to before the hiatus (p = 0.52). The raw data is plotted as a scatter to the left of each bar chart.

References

    1. Allouche S, Noble F, Marie N. Opioid receptor desensitization: mechanisms and its link to tolerance. Frontiers in Pharmacology. 2014;5. - PMC - PubMed
    1. Dang VC, Christie MJ. Mechanisms of rapid opioid receptor desensitization, resensitization and tolerance in brain neurons. British Journal of Pharmacology. 2012;165(6):1704–16. 10.1111/j.1476-5381.2011.01482.x - DOI - PMC - PubMed
    1. Williams JT, Ingram SL, Henderson G, Chavkin C, von Zastrow M, Schulz S, et al. Regulation of mu-Opioid Receptors: Desensitization, Phosphorylation, Internalization, and Tolerance. Pharmacological Reviews. 2013;65(1):223–54. 10.1124/pr.112.005942 - DOI - PMC - PubMed
    1. Brown EN, Lydic R, Schiff ND. Mechanisms of Disease: General Anesthesia, Sleep, and Coma. New England Journal of Medicine. 2010;363(27):2638–50. 10.1056/NEJMra0808281 - DOI - PMC - PubMed
    1. Baum A, Posluszny DM. Health psychology: mapping biobehavioral contributions to health and illness. Annu Rev Psychol. 1999;50:137–63. 10.1146/annurev.psych.50.1.137 . - DOI - PubMed

Publication types