. 2019 Apr 30;132(9):jcs225268.
doi: 10.1242/jcs.225268.

Evidence for a regulated Ca2+ entry in proximal tubular cells and its implication in calcium stone formation

Affiliations

Evidence for a regulated Ca2+ entry in proximal tubular cells and its implication in calcium stone formation

Cliff-Lawrence Ibeh et al. J Cell Sci. .

Abstract

Calcium phosphate (CaP) crystals, which begin to form in the early segments of the loop of Henle (LOH), are known to act as precursors for calcium stone formation. The proximal tubule (PT), which is just upstream of the LOH and is a major site for Ca2+ reabsorption, could be a regulator of such CaP crystal formation. However, PT Ca2+ reabsorption is mostly described as being paracellular. Here, we show the existence of a regulated transcellular Ca2+ entry pathway in luminal membrane PT cells induced by Ca2+-sensing receptor (CSR, also known as CASR)-mediated activation of transient receptor potential canonical 3 (TRPC3) channels. In support of this idea, we found that both CSR and TRPC3 are physically and functionally coupled at the luminal membrane of PT cells. More importantly, TRPC3-deficient mice presented with a deficiency in PT Ca2+ entry/transport, elevated urinary [Ca2+], microcalcifications in LOH and urine microcrystals formations. Taken together, these data suggest that a signaling complex comprising CSR and TRPC3 exists in the PT and can mediate transcellular Ca2+ transport, which could be critical in maintaining the PT luminal [Ca2+] to mitigate formation of the CaP crystals in LOH and subsequent formation of calcium stones.

Keywords: Ca2+ channel; Ca2+ signaling; Calcium phosphate stone; Loop of Henle; Renal calcium transport.


Conflict of interest statement

Competing interestsThe authors declare no competing or financial interests.

Figures
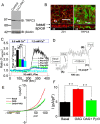
Fig. 1.
Fig. 1.
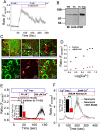
Expression and function of TRPC3 in PT cell line (LLC-PK1). (A) IB showing endogenous TRPC3 expression in mouse brain (lane 1, control) and LLC-PK1 (lane 2). (B) Representative confocal image (xy and xz sections) of LLC-PK1 cells showing expression of zonula occludens 1 (ZO1; green) and TRPC3 (green). The nuclei are stained with propidium iodide (PI, red). (C) Mean fluorescence traces of Fura-2-AM-loaded LLC-PK1 cells showing activation of CSR by L-Phe in presence of 0.5 mM [Ca2+]o and its inhibition when exposed to the allosteric CSR-inhibitor NPS-2143 (NPS; 1 μM), the TRPC channel blocker SKF-96365 (SKF; 1 μM) and the TRPC3 inhibitor (Pyr3; 3 μM). The bar diagram in the inset shows the peak Ca2+ response corresponding to the each Ca2+ transient expressed as the fluorescence ratio (F340/380) for each treatment condition (assigned colors mentioned in the figure) of the cells. The blue boxes above traces display the [Ca2+]o conditions. (D) The TRPC3 activator (OAG; 100 μM)-stimulated membrane current is blocked by Pyr3 (3 μM) in LLC-PK1 cells. (E) A current–voltage (I–V) relationship plot shows the OAG-induced outwardly rectified TRPC3 (blocked by Pyr3; 3 μM) current obtained by ramping from −100 to +100 mV. (F) Bars represent the average data (from experiments as in D) normalized to current densities. Results represent means±s.e.m. from n=4 experiments. *P<0.05; **P<0.01 (one-way ANOVA with post-hoc Tukey for C and F). Scale bars: 40 µm.
Fig. 2.
Fig. 2.
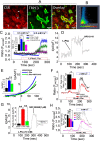
CSR mediates Ca2+ flux in PT cells. (A) Mean fluorescence traces of Fura-2-AM-loaded mice PT cells. Cells were bathed in Ca2+-free medium and extracellular Ca2+ was added (2 mM [Ca2+]o), followed by application of EGTA (5 mM). (B) IB showing CSR protein in renal medulla (KM) and cortex (KC). Ov. Exp., overexpression of CSR cDNA (1 µg using Lipofactamine 2000; Invitrogen) in HEK 293 cells. (C) Localization of CSR through immunofluorescence experiments in mouse kidney sections stained with anti-CSR (red) and anti-Na+-K+-ATPase (green) antibodies. White arrows indicate apical signal, and yellow arrows indicate basolateral signal. (D) Concentration-dependent activation of CSR in PT cells after changes in [Ca2+]o (0.5–12 mM), repeated with application of the CSR allosteric inhibitor (NPS-2143, 1 µM). (E) An [Ca2+]i increase is seen in mouse PT cells in response to extracellular Gd3+ (50 and 200 µM) that is blocked by the PLC inhibitor (U-73122; 500 µM), confirming GPCR involvement in the PLC pathway. U-73342 (500 µM), an inactive analog of U-73122, does not inhibit the [Ca2+]i response (black). (F) Ca2+-imaging traces of mouse PT cells showing changes in Fura-2 fluorescence due to CSR activation by 500 µM neomycin that induced Ca2+ release followed by Ca2+ entry, which was blocked in presence of SKF-96365 (1 μM). The bar diagrams in the insets for E and F show the peak Ca2+ entry for each condition. In F, 2 mM Ca2+ was added to elicit the Ca2+ entry. The blue boxes above traces display the [Ca2+]o. Results represent means±s.e.m from n=4 experiments. **P<0.01 (unpaired two-tailed t-test for E and F).
Fig. 3.
Fig. 3.
TRPC3 activation induces regulated Ca2+ entry in PT cells. (A) IB showing specific bands for TRPC3 (∼97 kDa) in kidney cortex (KC), but not in kidney medulla (KM). (B) Immunofluorescence staining of TRPC3 (green) and Na+-K+-ATPase (red) in a mouse kidney section. Arrows indicate cortical PT and strong signal in the brush border. (C–E) Fluo-4 Ca2+ imaging (confocal) traces illustrating domain specific (apical/basal) function of CSR–TRPC3 in PT cells (the insets in C show the areas measured): the average intensity data of the demarked (equal) regions (apical/basolateral) were plotted showing changes in Fluo-4 signal presented as F/F0 values (change in fluorescence signal excited at 488 nm with emission at 505 nm). Graphical presentations on the right are of average data showing a greater [Ca2+]i rise (peak Ca2+ entry) with (C) L-Phe and Ca2+; (D) apical application of OAG (100 µM) and its inhibition by addition of Pyr3 apically (3 µM) in PT cells, and (E) apical application of L-Phe in presence of Ca2+ inducing a more-pronounced apical Ca2+-entry signal compared to the basolateral region; Ca2+-entry decreased following apical application of Pyr3 (3 µM), but internal Ca2+-ER release was unaffected. The blue boxes below (C) or above (D,E) traces display the [Ca2+]o.  (F) Whole-cell patch clamp recording of mouse PT cells subjected to the indicated treatments. (G) Average data of basolateral control current and OAG (50 µM)-stimulated membrane currents in PT cells, which is almost completely blocked by Pyr3 (3 µM). I–V relationship plots show the outwardly rectified TRPC3 current obtained by ramping from −100 to +100 mV (reversal potential near 0 mV). (H) Bar graph represents mean data (from G) normalized to current densities. Results represent means±s.e.m. from n=4 experiments. **P<0.01 (unpaired two-tailed t-test for C–E and H).
Fig. 4.
Fig. 4.
Colocalization and function interaction of TRPC3 and CSR in PT cells. (A) Images show immunofluorescence staining of CSR (red) and TRPC3 (green) in a mouse kidney section ice. Arrows indicate CSR (white) and TRPC3 (yellow) stained at the apical region; in the overlay, blue arrows indicate the colocalization (yellow). (B) Colocalization analysis of CSR and TRPC3 in PT cells validated by calculating overlapping index (>75%) using Zen 2010 image analysis software. (C) Ca2+-imaging traces of PT cells bathed in 0.5 mM Ca2+, then with Ca2+ (2.5 mM) added (as shown in the blue boxes). Activation of CSR by aromatic amino acids L-Phe (10 mM) and L-Trp (12 mM) induced Ca2+ entry. Ca2+ entry was blocked by NPS-2143 (NPS, 1 µM). (D,E) Whole-cell patch clamp measurements of mouse PT cells in presence of extracellular solution containing 10 mM L-Phe and 1.2 mM Ca2+. Graphical plots of average data represented as a timecourse, showing currents at +100 mV after exposure to (D) L-Phe and NPS-2143 (1 µM), and (E) the average basal, L-Phe-induced and L-Phe +NPS-2143 currents (inset) plotted with an I–V relationship plot showing an outwardly rectified current ramping from −100 to +100 mV. (F) Ca2+ imaging traces of PT cells showing the response to activation of CSR by L-Phe (control; 10 mM) and blockade by SKF-96365 (SKF, 1 µM). The graph in the inset shows comparison of the peak Ca2+ entries between control and SKF-96365. (G) Whole-cell patch clamp measurements of mouse PT cells in the presence of 10 mM L-Phe with extracellular solution containing 1.2 mM Ca2+ and in the presence of SKF-96365 (1 µM). Graphical plots of average data represented as timecourse showing currents at +100 mV after exposure to L-Phe and SKF-96365. The graphs in the inset represents the average data of basal, L-Phe-induced and L-Phe+SKF-96365 currents normalized to current densities. (H) Ca2+ imaging traces of PT cells (control) showing response to activation of CSR by L-Phe (control) and blockade by Pyr3 (3 µM), Pyr6 (3 µM) and Pyr10 (3 µM); traces indicate functional CSR–TRPC3 signaling induced Ca2+ entry in PT cells. The graph in the inset shows comparison between the peak Ca2+ entries among the control, Pyr3, Pyr6 and Pyr10. Results represent means±s.e.m. from n=4 experiments. *P<0.05; **P<0.01 (unpaired two-tailed t-test for F, and one-way ANOVA with a post-hoc Tukey test for G and H). Scale bars: 20 µm.
Fig. 5.
Fig. 5.
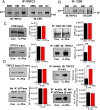
CSR activation and dynamic CSR-TRPC3 regulated TRPC3 function in PT cells. (A,B) IB of co-IP experiments performed using anti-TRPC3 and -CSR antibodies shows CSR–TRPC3 complex formation in homogenates of KC, KM and SMG (submandibular gland, used as a control). Arrows highlight the position of 97 kDa. (C) IB of co-IP experiments performed using anti-TRPC3 and -CSR antibodies showing L-Phe-induced TRPC3 and CSR complex formation in PT cell lysates. (D) Biotinylated protein lysates from PT cells were immunoprecipitated with NeutrAvidin beads. IB shows stimulation of CSR with Ca2+ (2 mM) plus L-Phe (10 mM) in PT cells, which induced an increase in TRPC3+CSR complexes (compared to unstimulated). Na+/K+-ATPase was used to show specificity in biotinylation co-IP. Bands were quantified and are represented as graphs on the right. Results represent means±s.e.m. from n=3 experiments. **P<0.01 (unpaired two-tailed t-test for C and D).
Fig. 6.
Fig. 6.
Reduction in CSR-mediated Ca2+ entry in TRPC3 KO PT cells. (A) Ca2+ imaging traces of PT cells from WT and TRPC3 KO mice stimulated with neomycin (0 and 2 mM Ca2+) and (B) 20 mM L-Phe (0.5 and 2 mM Ca2+; blue boxes above traces). Both agonists induced CSR activation with Ca2+-entry in WT PT cells; these responses were reduced in KO PT cells, showing disruption of Ca2+ entry into PT cells of TRPC3 KO mice. The graphs in the inset show comparison of peak Ca2+ entries between WT and TRPC3 KO. (C) Average Ca2+ entry in response to L-Phe (20 mM) and L-Phe+Pyr3 (3 µM) in TRPC3 KO PT cells. (D) Whole-cell patch clamp measurements in response to L-Phe in WT and TRPC3 KO mice showing reduced current in TRPC3 KO PT cells. (E) Amount of current inhibited by specific CSR and TRPC inhibitors in WT and TRPC3 KO cells (compared to the basal current at +100 mV). (F) Inhibition of L-Phe-induced current in PT cells of WT and TRPC3 KO mice after treatment with the novel TRPC3 channel blocker (Pyr10; 3 µM). (G) [Li+] excretion amount in WT and TRPC3 KO mice urine over ≤100 h. The bar graph in the inset shows [Li+] excretion 96 h after feeding. Results represent means±s.e.m. from n=4 experiments. **P<0.01 (unpaired two-tailed t-test for A–G).
Fig. 7.
Fig. 7.
Expression, localization and functionality of transcellular pathway machinery in mouse kidney. (A) Transcript levels in WT whole kidney tissue; WT PT cells and TRPC3 KO PT cells were analyzed by RT-PCR and representative gel images were obtained. Gene expression was quantified, normalized to Gapdh and represented as a bar graph. (B,C) Distribution and localization of (B) NCX1 (red; highlighted with white arrows) and (C) PMCA1 (green; highlighted with purple arrows) were determined by immunofluorescence staining using megalin (green; highlighted with yellow arrows) as a PT marker in WT mouse kidney sections. (D) Ca2+ imaging traces of WT PT cells showing L-Phe-induced Ca2+-flux and the effect of PMCA inhibitor (carboxyeosin; 10 µM) and NCX inhibitor (KB-R7943; 15 µM). Corresponding (E) Ca2+ peak entry, (F) Ca2+ entry rise and (G) Ca2+ entry reduction are represented as bar diagrams. Results represent means±s.e.m. from n=4 experiments. **P<0.01 (unpaired two-tailed t-test for A and E–G). Scale bars: 20 µm.
Fig. 8.
Fig. 8.
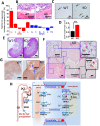
Stone-forming phenotype in TRPC3 KO mice. (A) Percentage change in urine/serum electrolytes in TRPC3 KO mice relative to WT littermates. (B) H&E-stained sections of WT and TRPC3 mice bone show no abnormalities. (C) Images (light microscopy) show Alizarin Red (pH 4.3)-stained urine of WT and TRPC3 KO, showing CaP crystals (arrows). (D) Quantitative analysis of CaP crystal area from images as in C. (E) H&E-stained kidney sections (sagittal) of WT and TRPC3 KO mice show no apparent abnormality in TRPC3 KO mice kidney. (F) Images show representative TRPC3 KO mice kidney (stained with von Kossa for calcium) showing black stains (for calcified material detection). Insets outlined in blue are enlarged images from the indicated medullary LOH region. Green arrows indicate calcium crystals. Insets outlined in black show a larger calcified crystal in the calyx region. Red arrows in the black inset indicate calcified crystals. (G) Representative image (light microscopy) of an Alizarin Red (pH 4.3)-stained WT and TRPC3 KO mouse kidney section. Results represent means±s.e.m. from n=3 experiments. **P<0.01 (unpaired two-tailed t-test in D). Arrows highlight CaP crystals. (H) Schema of proposed PT Ca2+ transport mechanism and molecular targets (ion channels/transporters). Enlarged tubule shows the proposed mechanism. (1) Activation of CSR. (2) CSR transactivation of TRPC3 though a PLC-dependent mechanism (3) causes Ca2+ entry into the PT cells through a transcellular route. (4) This process causes a transcellular flow of Ca2+ across the PT epithelia, causing Ca2+ reabsorption (lumen to the interstitium).

References

    1. Asplin J. R., Mandel N. S. and Coe F. L. (1996). Evidence of calcium phosphate supersaturation in the loop of Henle. Am. J. Physiol. 270, F604-F613. 10.1152/ajprenal.1996.270.4.F604 - DOI - PubMed
    1. Ba J., Brown D. and Friedman P. A. (2003). Calcium-sensing receptor regulation of PTH-inhibitable proximal tubule phosphate transport. Am. J. Physiol. Renal Physiol. 285, F1233-F1243. 10.1152/ajprenal.00249.2003 - DOI - PubMed
    1. Balasubramaniam S. L., Gopalakrishnapillai A., Petrelli N. J. and Barwe S. P. (2017). Knockdown of sodium-calcium exchanger 1 induces epithelial to mesenchymal transition in kidney epithelial cells. J. Biol. Chem. 292, 11388-11399. 10.1074/jbc.M116.752352 - DOI - PMC - PubMed
    1. Bandyopadhyay B. C., Swaim W. D., Liu X., Redman R. S., Patterson R. L. and Ambudkar I. S. (2005). Apical localization of a functional TRPC3/TRPC6-Ca2+-signaling complex in polarized epithelial cells role in apical Ca2+ influx. J. Biol. Chem. 280, 12908-12916. 10.1074/jbc.M410013200 - DOI - PubMed
    1. Bandyopadhyay B. C., Ong H. L., Lockwich T. P., Liu X., Paria B. C., Singh B. B. and Ambudkar I. S. (2008). TRPC3 controls agonist-stimulated intracellular Ca2+ release by mediating the interaction between inositol 1, 4, 5-trisphosphate receptor and RACK1. J. Biol. Chem. 283, 32821-32830. 10.1074/jbc.M805382200 - DOI - PMC - PubMed

Publication types