. 2019 Mar 25;10(1):1065.
doi: 10.1038/s41467-019-08871-1.

Bone marrow central memory and memory stem T-cell exhaustion in AML patients relapsing after HSCT

Affiliations

Bone marrow central memory and memory stem T-cell exhaustion in AML patients relapsing after HSCT

Maddalena Noviello et al. Nat Commun. .

Abstract

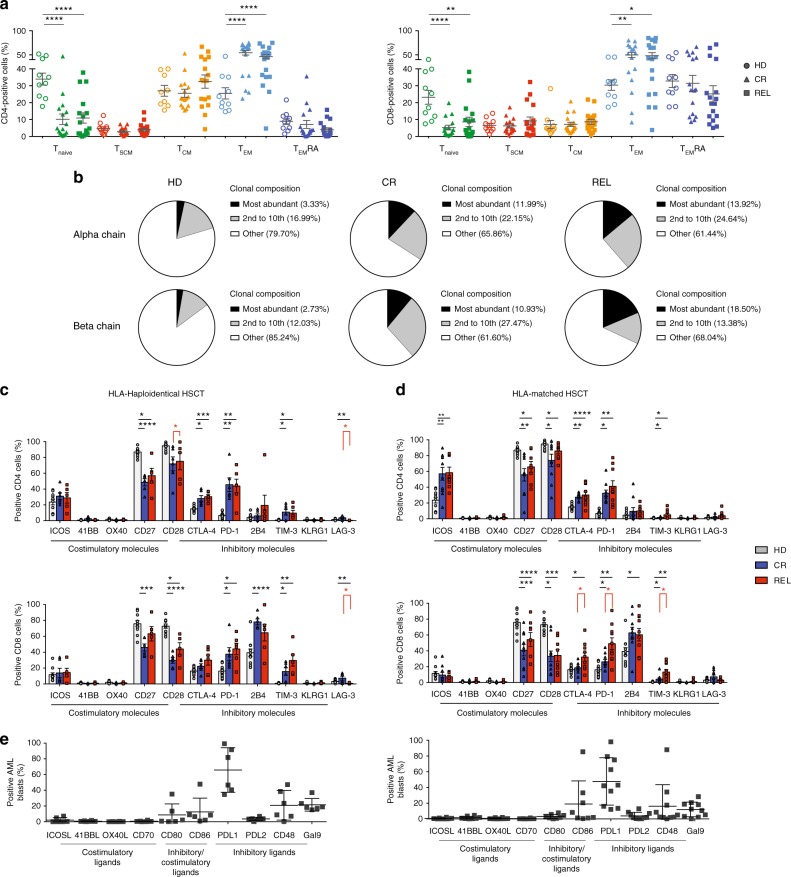
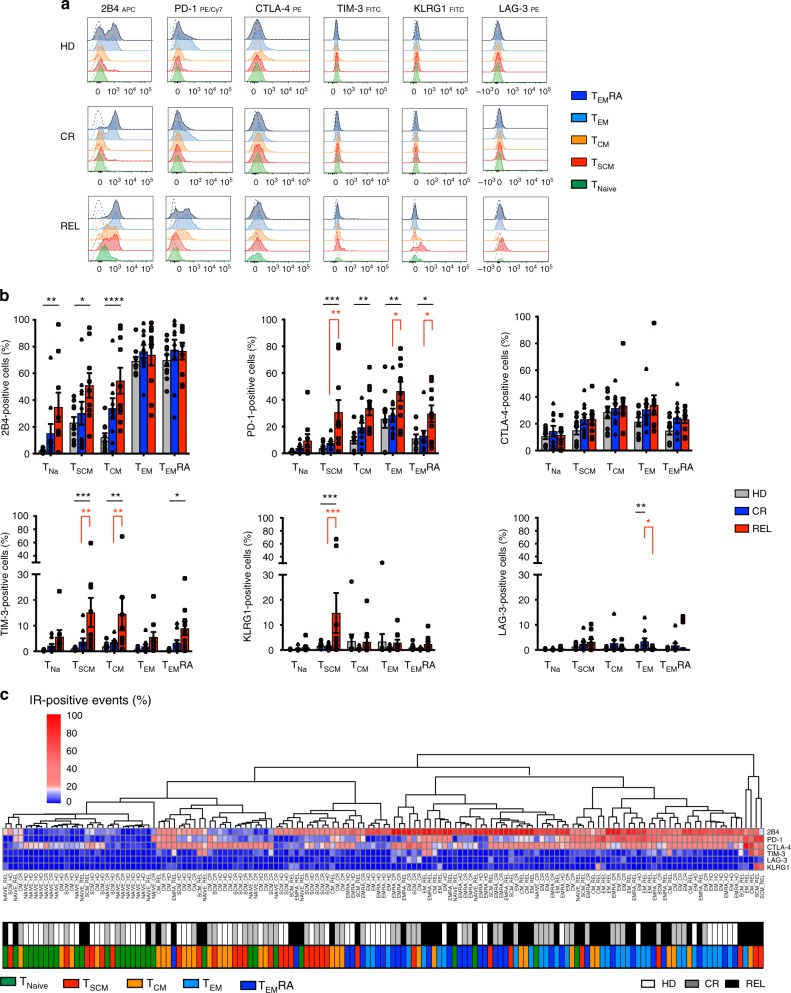
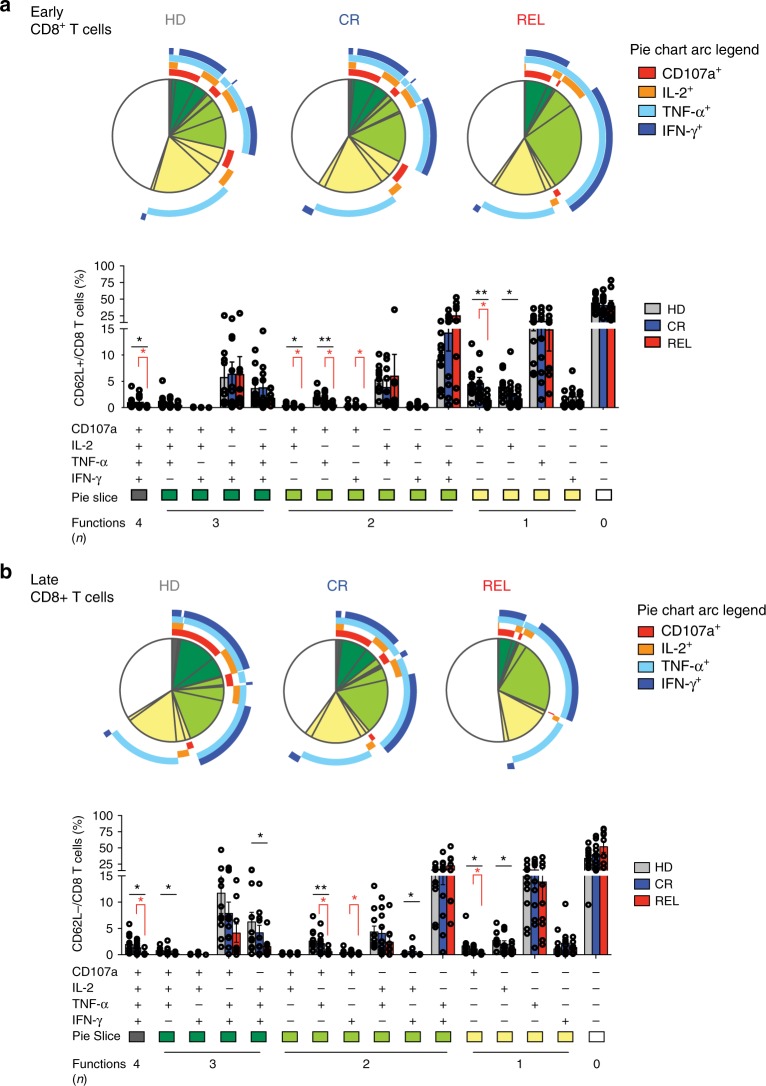
The major cause of death after allogeneic Hematopoietic Stem Cell Transplantation (HSCT) for acute myeloid leukemia (AML) is disease relapse. We investigated the expression of Inhibitory Receptors (IR; PD-1/CTLA-4/TIM-3/LAG-3/2B4/KLRG1/GITR) on T cells infiltrating the bone marrow (BM) of 32 AML patients relapsing (median 251 days) or maintaining complete remission (CR; median 1 year) after HSCT. A higher proportion of early-differentiated Memory Stem (TSCM) and Central Memory BM-T cells express multiple IR in relapsing patients than in CR patients. Exhausted BM-T cells at relapse display a restricted TCR repertoire, impaired effector functions and leukemia-reactive specificities. In 57 patients, early detection of severely exhausted (PD-1+Eomes+T-bet-) BM-TSCM predicts relapse. Accordingly, leukemia-specific T cells in patients prone to relapse display exhaustion markers, absent in patients maintaining long-term CR. These results highlight a wide, though reversible, immunological dysfunction in the BM of AML patients relapsing after HSCT and suggest new therapeutic opportunities for the disease.


Conflict of interest statement

C.B. received research support from Molmed s.p.a and Intellia Therapeutics. A.B. received research support from TxCell. L.V. received research support from GenDx and Moderna Therapeutics. The remaining authors declare no competing interests.

Figures

Fig. 1
Fig. 1
T-cell subset phenotype in the bone marrow of HSCT patients differs according to the clinical outcome and transplant type. a Proportion of naive (CD45RA+CD62L+CD95, Tnaive), memory stem (CD45RA+CD62L+CD95+, TSCM), central memory (CD45RACD62L+, TCM), effector memory (CD45RACD62L, TEM) T cells and terminal effectors (CD45RA+CD62L, TEMRA) over the total CD4+ and CD8+ BM-T-cell subsets in healthy donors (HD, N = 11), in patients who achieved long-term complete remission (CR, N = 16) and in patients who experienced relapse (REL, N = 16) after HSCT. b Pie charts depicting the relative abundance of T-cell clones in each study group (HD, N = 3; CR, N = 3; REL, N = 3) obtained after CDR3 sequencing of both TCR-α and TCR-β chains. c, d Percentages of BM-infiltrating CD4+ and CD8+ T cells positive for costimulatory or inhibitory receptors in HLA-haploidentical (N = 12, c) or HLA-matched (N = 20, d) transplant settings; bone marrow samples from healthy donors were used as controls (HD, N = 11). e Percentages of leukemic blasts at relapse expressing costimulatory or inhibitory ligands in patients receiving HLA-haploidentical (left) or HLA-matched (right) transplants. All the inhibitory receptors have been visualized by means of cell surface staining apart for CTLA-4, visualized after cell fixation and permeabilization. Individual patient data points, mean, and SEM are shown. Statistically significant differences between CR and REL groups are highlighted in red, the differences between patients’ groups and HD in black. *p < 0.05; **p < 0.01; ***p < 0.001; ****p < 0.0001; nonparametric unpaired two-sided T test
Fig. 2
Fig. 2
BH-SNE and K-means tandem application evaluates IR coexpression. a A median of 7500 CD3+ lymphocytes from bone marrow samples were studied with BH-SNE algorithm (top) and plotted according to the calculated variables BH-SNE1 and BH-SNE2 (mid); the events were then split into three density plots according to the study group they belong to (healthy donors, N = 10 HD; patients achieving long-term remission after transplant, CR N = 10; and patients experiencing post-transplant relapse, REL N = 10); representative histograms of PD-1, 2B4, KLRG1, and LAG-3 from selected areas are reported (bottom). b K-means algorithm was applied to BH-SNE1 and BH-SNE2 variables, and a fraction of the identified meta-clusters were attributed to each experimental group (HD, CR, and REL). c Composition of meta-clusters ascribed to a specific experimental group (variables analyzed in panel 1 and panel 2 are detailed in the Methods section). d, e HD-, CR-, or REL-specific meta-clusters were described in terms of both relative fluorescence intensity (RFI, d) and multiple expression (e) of inhibitory receptors. Individual patients datapoint, means, and SEM are shown. Statistically significant differences between CR and REL groups are highlighted in red and the differences between patients’ groups and HD in black. *p < 0.05; **p < 0.01; ***p < 0.001; ****p < 0.0001; nonparametric unpaired two-sided T test
Fig. 3
Fig. 3
Exhausted CD8+ TSCM and TCM infiltrate the bone marrow of relapsing patients. a Representative histograms showing the inhibitory receptor expression profile in CD8+ naive (CD45RA+CD62L+CD95, Tnaive), memory stem (CD45RA+CD62L+CD95+, TSCM), central memory (CD45RACD62L+, TCM), effector memory (CD45RACD62L, TEM) T cells, and terminal effectors (CD45RA+CD62L, TEMRA) in healthy donors (HD, N = 10), in HLA-matched patients maintaining complete remission (CR, N = 10) or relapsing after transplant (REL, N = 10). Fluorescence-minus one (FMO) negative controls (dashed lines) are shown for each subpopulation. b Relative proportion of IR-expressing CD8+ T cells in each memory subpopulation from the different experimental groups (HD, CR, and REL). c Heatmap representing percentage of positive cells for all samples classified according to the memory differentiation status (N = 5 inputs per samples, N = 150 total inputs); every input was associated with two colored tags, one referring to the memory status (TNa green, TCM orange, TSCM red, TEM light blue, TEMRA dark blue) and one to the experimental group (HD white, CR gray, REL black). All the inhibitory receptors have been visualized by means of cell surface staining apart for CTLA-4, visualized after cell fixation and permeabilization. Individual patient data points, means, and SEM are shown. Statistically significant differences between CR and REL groups are highlighted in red and the differences between patients’ groups and HD in black. *p < 0.05; **p < 0.01; ***p < 0.001; ****p < 0.0001; two-way ANOVA with no matching coupled with Sidak multiple correction test
Fig. 4
Fig. 4
CD8+ BM-T cells from relapsing patients display defective polyfunctionality. Cytokine production (IL-2, TNF-α, IFN-γ) and degranulation capacity (CD107a expression) of CD8+ T cells upon PMA/Ionomycin stimulation were evaluated in bone marrow samples. a, b Pie charts with arcs (upper part) and bar chart (lower part) showing the relative proportion of CD8+ T cells performing four, three, or two multiple effector functions or one or no effector functions in early-differentiated (CD62L+, a) and late differentiated (CD62L, b) subsets. Healthy donors (HD, N = 10), HLA-matched patients maintaining complete remission (CR, N = 10) or relapsing after transplant (REL, N = 10) were evaluated. Arcs represent which function was exerted, alone or in combination with the others (CD107a, IL-2, TNF-α, and IFN-γ). Individual patient data points, means, and SEM are shown. Statistically significant differences between CR and REL groups are highlighted in red and the differences between patients’ groups and HD in black. *p < 0.05; **p < 0.01; ***p < 0.001; ****p < 0.0001, nonparametric unpaired two-sided T test
Fig. 5
Fig. 5
The functional exhaustion of IR+ BM-T cells at relapse is reverted in vitro. BM-infiltrating CD8+ T cells from N = 6 patients experiencing relapse were isolated according to the expression of IRs and expanded in vitro. a Gating strategy for the definition of IR+ (expression of at least one IR among TIM-3, PD-1, and 2B4) and IR (TIM-3 PD-1 2B4) T cells. b Pie charts depicting the relative abundance of T-cell clones in IR+ (N = 3) and IR (N = 2) cells obtained after CDR3 sequencing of both TCR-α and TCR-β chains. c Expansion rate of IR+ and IR T cells after in vitro polyclonal stimulation with OKT3 in presence of high doses of IL-2. d, e Representative plots (d) and bar graph (e) showing T-cell effector functions measured on ex vivo samples (dashed bars) or on in vitro expanded IR+ (black bars) and IR (white bars) T cells after short-term polyclonal stimulation (PMA/Ionomycin); two-way ANOVA with no matching coupled with Sidak multiple corrections test was used for statistical analyses. f, g IR+ and IR T cells, expanded in vitro upon polyclonal stimulation and in the absence of any procedure to enrich for leukemia-specific T cells, were co-coltured with matched AML blasts at different effector-to-target (E:T) ratios; at day 1, Granzyme A and B production was quantified (f), and at day 3 the elimination index (g) was calculated; two-way ANOVA with no matching coupled with Sidak multiple corrections test and nonparametric paired two-sided T test were used for statistical analyses, respectively. Means and SEM are shown. *p < 0.05; **p < 0.01; ***p < 0.001
Fig. 6
Fig. 6
A phenotype of exhaustion characterizes tumor-specific T cells early after transplant. a Proportion of PD-1+ CD8+ BM-T cells expressing T-bet and EOMES transcription factors in different T-cell subsets of healthy donors (HD, N = 8), patients who will maintain long-term complete remission (CR, N = 37) or will experience disease relapse (REL, N = 20). b BH-SNE analysis of CR and REL CD8+ BM-T cells at this early time point. The BH-SNE1/BH-SNE2 biaxial plot for CR and REL and the composition of HLA-DR clusters are reported (left), together with the MFIs of inhibitory receptors (center) and the percentages (right) of CD8+ BM-T cells expressing inhibitory receptors in the CR- and REL-specific HLA-DR clusters. c Representative plot of inhibitory receptors expression by CR or REL tumor-specific CD8+ T cells and their quantification by histograms, compared with viral-specific CD8+ T cells. d Percentages of expression of multiple inhibitory receptors by viral and tumor-specific T cells. Individual patient data points, means, and SEM are shown. Statistically significant differences between CR and REL groups are highlighted in red and the differences between patients’ groups and HD in black. *p < 0.05, **p < 0.01, ***p < 0.001, ****p < 0.0001, nonparametric unpaired two-sided T test

References

    1. Horowitz, M. et al. Epidemiology and biology of relapse after stem cell transplantation. Bone Marrow Transplant. 1–11. 10.1038/s41409-018-0171-z (2018). - PMC - PubMed
    1. Horowitz MM, et al. Graft-versus-leukemia reactions after bone marrow transplantation. Blood. 1990;75:555–562. - PubMed
    1. Fearon DT, Manders P, Wagner SD. Arrested differentiation, the self-renewing memory lymphocyte, and vaccination. Science. 2001;293:248–250. doi: 10.1126/science.1062589. - DOI - PubMed
    1. Gattinoni L, et al. A human memory T cell subset with stem cell–like properties. Nat. Med. 2011;17:1290–1297. doi: 10.1038/nm.2446. - DOI - PMC - PubMed
    1. Lanzavecchia A, Sallusto F. Progressive differentiation and selection of the fittest in the immune response. Nat. Rev. Immunol. 2002;2:982–987. doi: 10.1038/nri959. - DOI - PubMed

Publication types

MeSH terms