. 2019 Mar 25;9(1):5109.
doi: 10.1038/s41598-019-40885-z.

Choline kinase inhibitors EB-3D and EB-3P interferes with lipid homeostasis in HepG2 cells

Affiliations

Choline kinase inhibitors EB-3D and EB-3P interferes with lipid homeostasis in HepG2 cells

Alberto Sola-Leyva et al. Sci Rep. .

Abstract

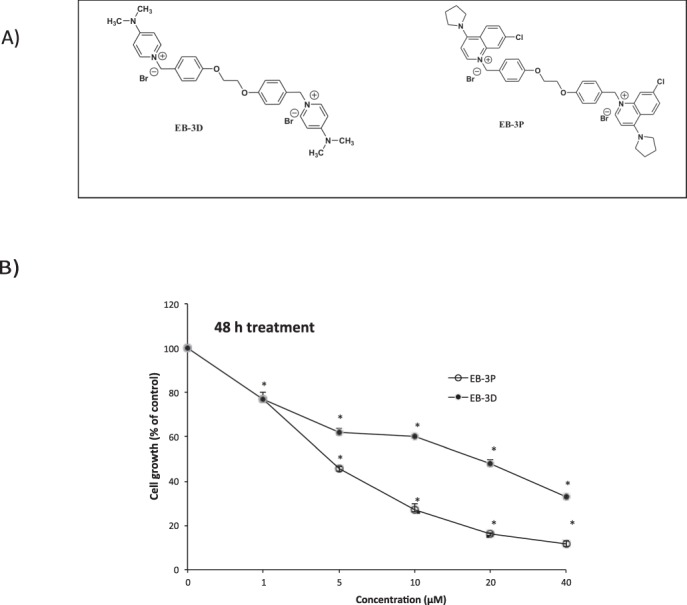
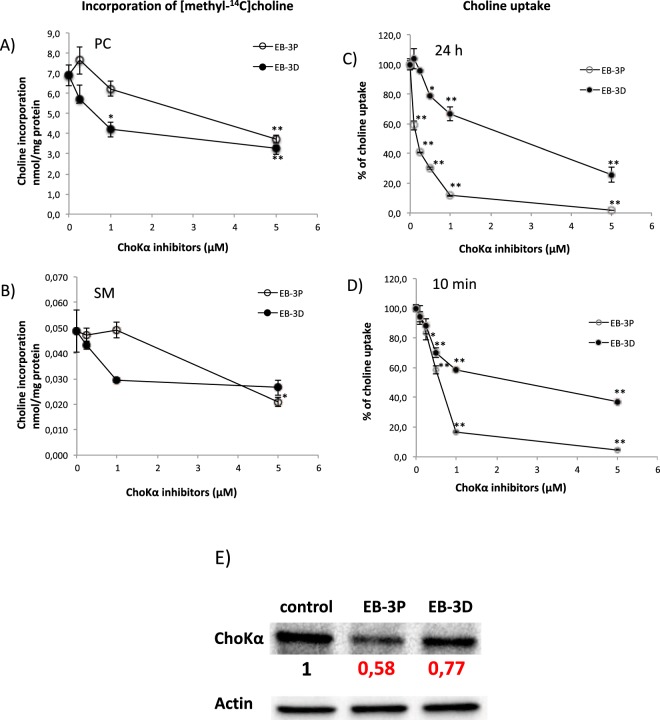
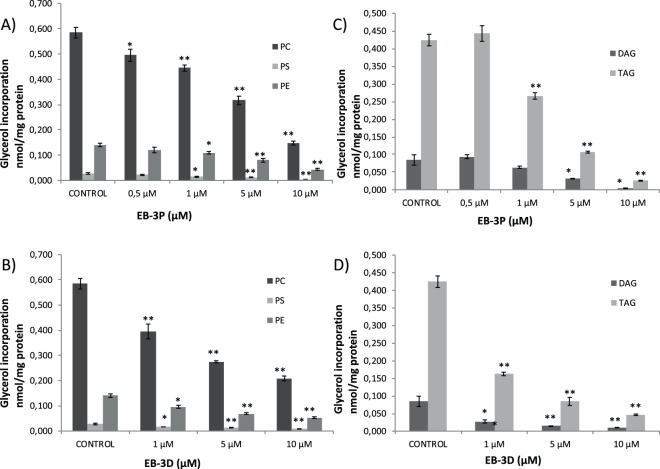
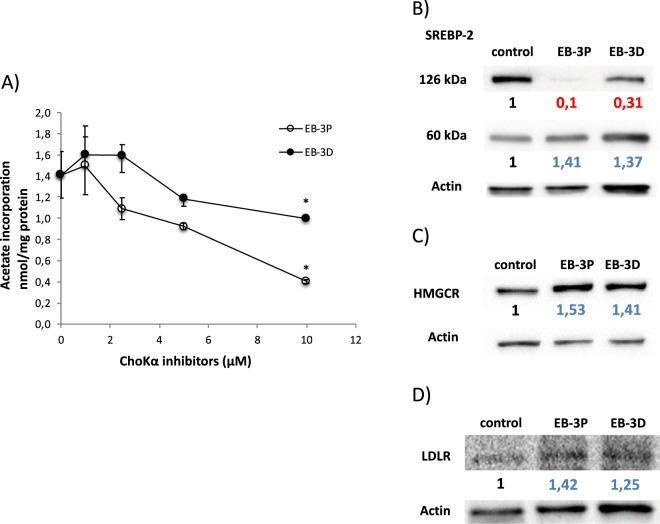
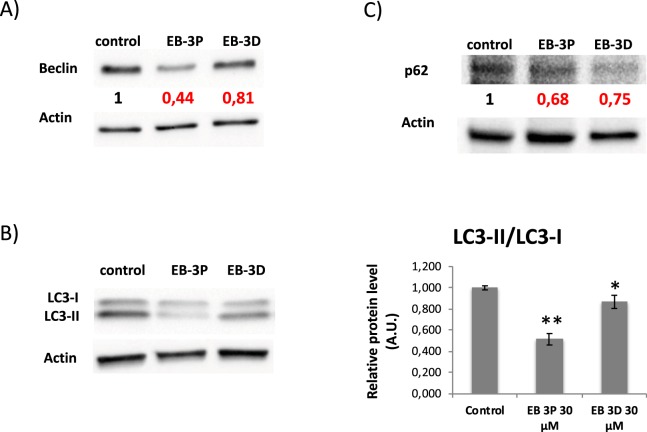
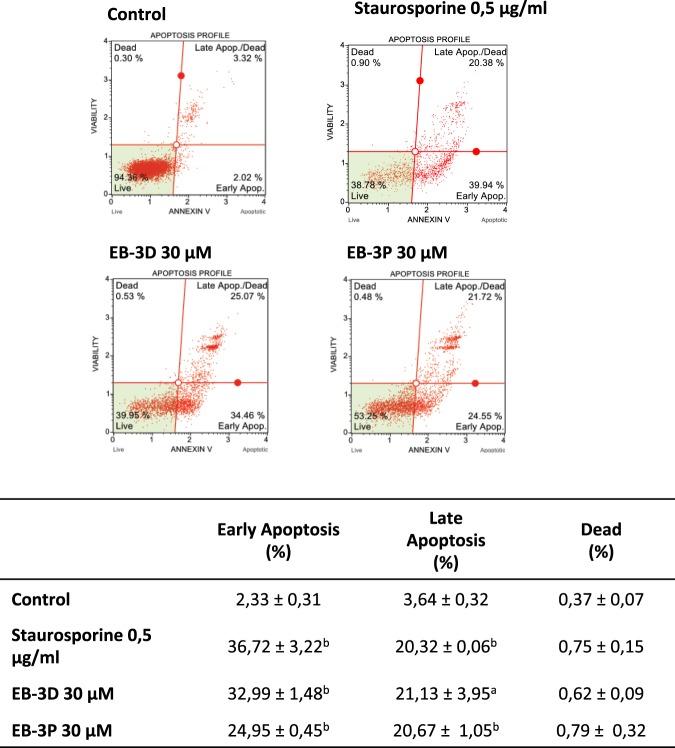
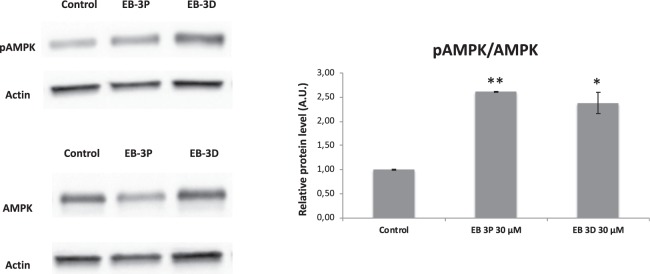
A full understanding of the molecular mechanism of action of choline kinase α (ChoKα) inhibitors at the cell level is essential for developing therapeutic and preventive approaches for cancer. The aim of the present study was to evaluate the effects of the ChoKα inhibitors EB-3D and EB-3P on lipid metabolism in HepG2 cells. We used [methyl-14C]choline, [1,2-14C]acetic acid and [2-3H]glycerol as exogenous precursors of the corresponding phospholipids and neutral lipids. [Methyl-14C]choline was also used to determine choline uptake. Protein levels were determined by Western blot. Ultrastructural alterations were investigated by transmission electron microscopy. In this work, we demonstrate that EB-3D and EB-3P interfere with phosphatidylcholine biosynthesis via both CDP-choline pathway and choline uptake by the cell. Moreover, the synthesis of both diacylglycerols and triacylglycerols was affected by cell exposure to both inhibitors. These effects were accompanied by a substantial decrease in cholesterol biosynthesis, as well as alterations in the expression of proteins related to cholesterol homeostasis. We also found that EB-3D and EB-3P lowered ChoKα protein levels. All these effects could be explained by the modulation of the AMP-activated protein kinase signalling pathway. We show that both inhibitors cause mitochondrial alteration and an endoplasmic reticulum stress response. EB-3D and EB-3P exert effects on ChoKα expression, AMPK activation, apoptosis, endoplasmic reticulum stress and lipid metabolism. Taken together, results show that EB-3D and EB-3P have potential anti-cancer activity through the deregulation of lipid metabolism.


Conflict of interest statement

The authors declare no competing interests.

Figures

Figure 1
Figure 1
(A)Chemical structure of synthetic ChoKα inhibitors EB-3P and EB-3D. (B) Effects of EB-3D and EB-3P on HepG2 cell proliferation. HepG2 cells growing in the log phase were incubated with MEM/10% FBS in the presence or absence of different concentrations of ChoKα inhibitors for 48 h. Cell number was determined by crystal-violet staining and expressed as a percentage of the control cells. These experiments were performed twice in triplicate. *P< 0.0001.
Figure 2
Figure 2
Effects of EB-3D and EB-3P on [methyl-14C]choline incorporation into phospholipids, choline uptake and ChoKα protein levels in HepG2 cells. Log-phase HepG2 cells were incubated with ChoKα inhibitors as described in Methods section. The incorporation of choline into PC (A) and SM (B) is expressed as nmol of choline incorporated per mg of cell protein. Choline uptake was determined in cells treated for 24 h (C) or 10 min (D) and expressed as a percentage of the control cells. Results represent the mean ± SEM of three independent experiments conducted in triplicate. *P < 0.05, **P < 0.001 when compared with control values. In E) it is represented the protein levels of ChoKα normalized to their respective β-actin level and expressed as x-fold change compared with the corresponding control ratio (1.0). The Western blot image shows a representative experiment repeated three times.
Figure 3
Figure 3
Effects of EB-3D and EB-3P on [2-3H]glycerol incorporation into lipids in HepG2 cells. Log-phase HepG2 cells were exposed to ChoKα inhibitors for 24 h. Then, cells were incubated with [2-3H]glycerol as described in Methods section. The incorporation of glycerol into phospholipids (A,B) and neutral lipids (C,D) is expressed as nmol of glycerol incorporated per mg of cell protein and represent the mean ± SEM of two independent experiments conducted in triplicate. *P < 0.05 **P < 0.005 when compared with control values.
Figure 4
Figure 4
Effects of EB-3D and EB-3P on [1,2-14C]acetic acid incorporation into cholesterol and SREBP-2, HMGCR and LDLR protein levels in HepG2 cells. Log-phase HepG2 cells were incubated with ChoKα inhibitors for 24 h. Then, cells were incubated with [1,2-14C]acetic acid as described in the Methods section. The incorporation of acetate into cholesterol (A) is expressed as nmol of acetate incorporated per mg of cell protein and represent the mean ± SEM of two independent experiments conducted in triplicate. *P < 0.05 when compared with control values. In (B) SREBP-2, (C) HMGCR and (D) LDLR are represented the protein levels normalized to their respective β-actin level and expressed as x-fold change compared with the corresponding control ratio (1.0). Western blots show a representative experiment repeated three times.
Figure 5
Figure 5
Effects of EB-3D and EB-3P on (A) Beclin, (B) LC3 and (C) p62 protein levels. HepG2 cells were incubated without any additions (control) or ChoKα inhibitors for 24 h. Protein levels in the samples were normalized to their respective β-actin level and expressed as x-fold change compared with the corresponding control ratio (1.0). Western blots show a representative experiment repeated three times. Ratios between the intensity of the bands corresponding to LC3-II and LC3-I are shown (right panel). *P < 0.05, **P < 0.001 compared to control value.
Figure 6
Figure 6
Effect of EB-3D and EB-3P on apoptosis in HepG2 cells. HepG2 cells were incubated in the absence and presence of 30 μM ChoKα inhibitors or 0.5 μg·mL−1 staurosporine for 24 h. Cells were collected and analysed by flow-cytometry to determine apoptosis, as described in the Methods section. Figure shows representative flow-cytometry images of the control and treated cells. The percentages of each cell population are included in a table in which results are expressed as the mean ± SEM of three independent experiments conducted in triplicate. aP < 0.05, bP < 0.005 when compared with control values.
Figure 7
Figure 7
Effects of EB-3D and EB-3P on the expression of endoplasmic reticulum stress markers and on mitochondrial membrane potential in HepG2 cells. HepG2 cells were incubated without any additions or ChoKα inhibitors for 24 h. Protein levels of CHOP/GADD153 (A) and IRE1α (B) in the samples were normalized to their respective β-actin level and expressed as x-fold change compared with the corresponding control ratio (1.0). Western blots show a representative experiment repeated three times. For mitochondrial membrane potential determination we used JC-10 as described in Methods section. The ratio of red/green fluorescence intensity was used to determine the values of MMP. Results are expressed as the mean ± SEM of three independent experiments conducted in triplicate. *P < 0.05, **P < 0.001 when compared with control values.
Figure 8
Figure 8
Ultrastructural alterations produced by ChoKα inhibitors. (A) Control HepG2 cells. (AV) Autophagic vacuole. (B) HepG2 cell exposed to EB-3D 10µM show ultrastructure similar to untreated cells. (C) Treatment with EB-3D 30 µM. Some dilatation of endoplasmic reticulum (ER) as well as of perinuclear space (Ps) is visible. (D) 24 h of exposure to EB-3P 10 µM. Cell shows a clear dilatation of ER cisternae and nuclear lobulation. (E) Treatment with EB-3P 30 µM increases the dilatation of ER. Ps is also dilated. (F) Detail of an EB-3P-treated cell showing wide ER cisternae and mitochondrial (M) rarefaction. (G) Cell in apoptotic stage induced by treatment with EB-3P. Picnotic nucleus (N), with many chromatinic bodies and perinuclear space notably dilated, is shown. Mitochondria are disorganised and great cytoplasmic vacuoles (V) appear as result of cell disorganization. Cell membrane (CM) rupture can be seen at some points.
Figure 9
Figure 9
Effects of EB-3D and EB-3P on AMPK protein levels. HepG2 cells were incubated without any additions or ChoKα inhibitors for 24 h. The bands corresponding to pAMPK and total AMPK were scanned, and arbitrary units were assigned by densitometric analysis. The figure shows a representative experiment repeated three times (left panel). Ratios between the intensity of the bands corresponding to pAMPK and AMPK are shown and expressed as x-fold change compared with the corresponding control ratio (1.0) (right panel). *P < 0.05, **P < 0.001 compared to control value.

References

    1. Siegel RL, Miller KD, Jemal A. Cancer Statistics. CA Cancer J Clin. 2018;1:7–30. doi: 10.3322/caac.21442. - DOI - PubMed
    1. Huang C, Freter C. Lipid metabolism, apoptosis and cancer therapy. Int. J. Mol. Sci. 2015;16:924–949. doi: 10.3390/ijms16010924. - DOI - PMC - PubMed
    1. Galbraith L, Leung HY, Ahmad I. Lipid pathway deregulation in advanced prostate cancer. Pharmacol. Res. 2018;131:177–184. doi: 10.1016/j.phrs.2018.02.022. - DOI - PubMed
    1. Szachowicz-Petelska B, et al. Phospholipid Composition and Electric Charge in Healthy and Cancerous Parts of Human Kidneys. J. Membr. Biol. 2013;246:421–425. doi: 10.1007/s00232-013-9554-7. - DOI - PMC - PubMed
    1. Cheng M, Bhujwalla ZM, Glunde K. Targeting Phospholipid Metabolism in Cancer. Front. Oncol. 2016;6:266. doi: 10.3389/fonc.2016.00266. - DOI - PMC - PubMed

Publication types

MeSH terms