. 2019 Mar 25;9(1):5105.
doi: 10.1038/s41598-019-41516-3.

Frequency-specific coupling in fronto-parieto-occipital cortical circuits underlie active tactile discrimination

Affiliations

Frequency-specific coupling in fronto-parieto-occipital cortical circuits underlie active tactile discrimination

Carolina Kunicki et al. Sci Rep. .

Abstract

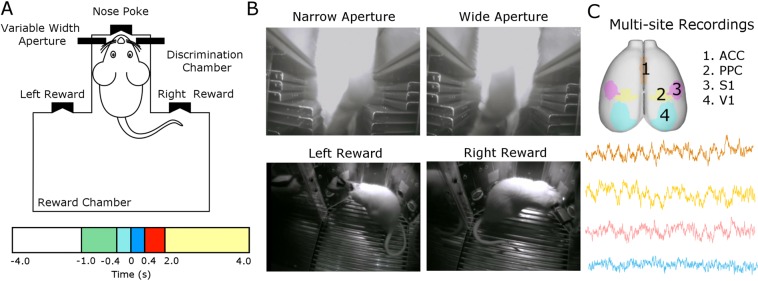
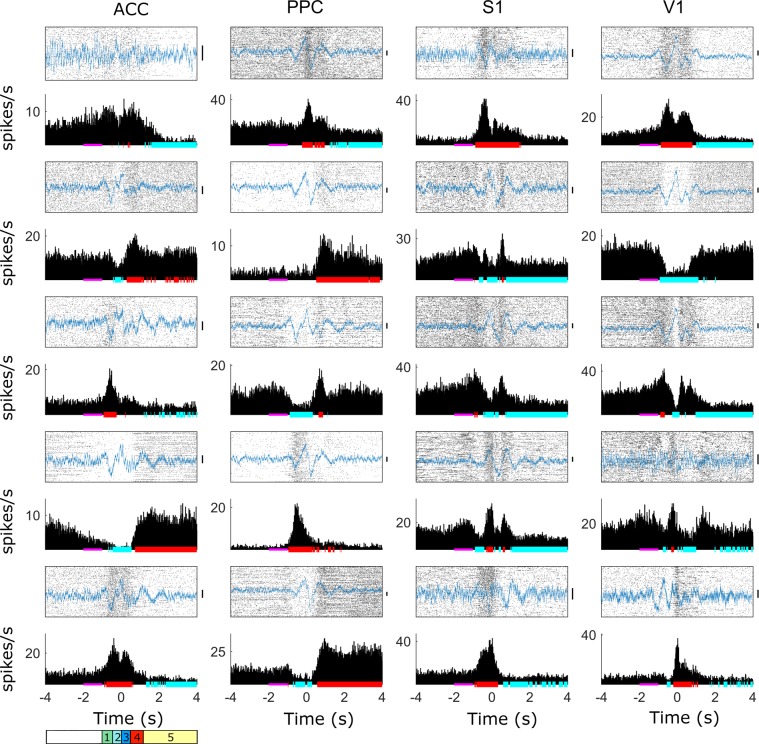
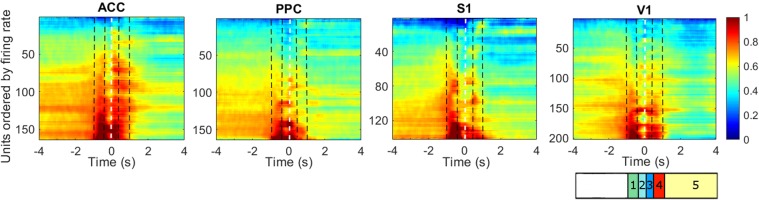
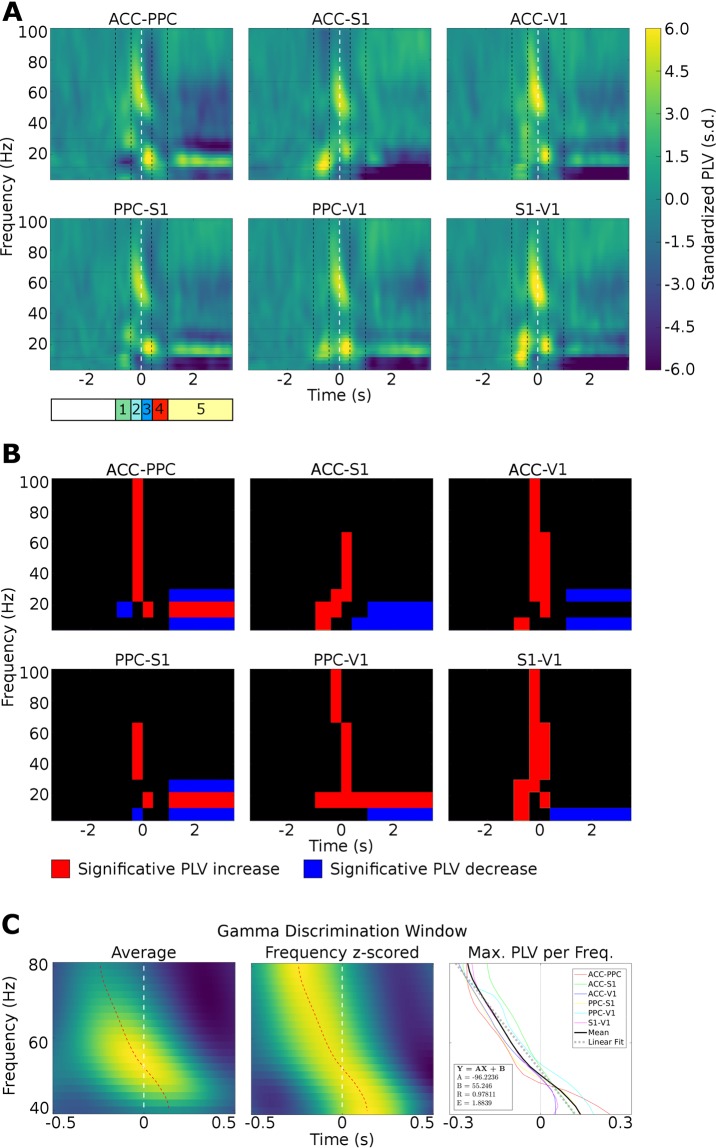
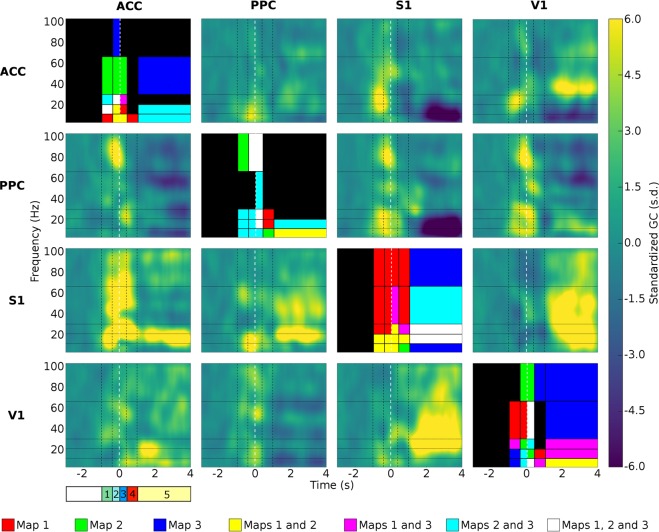
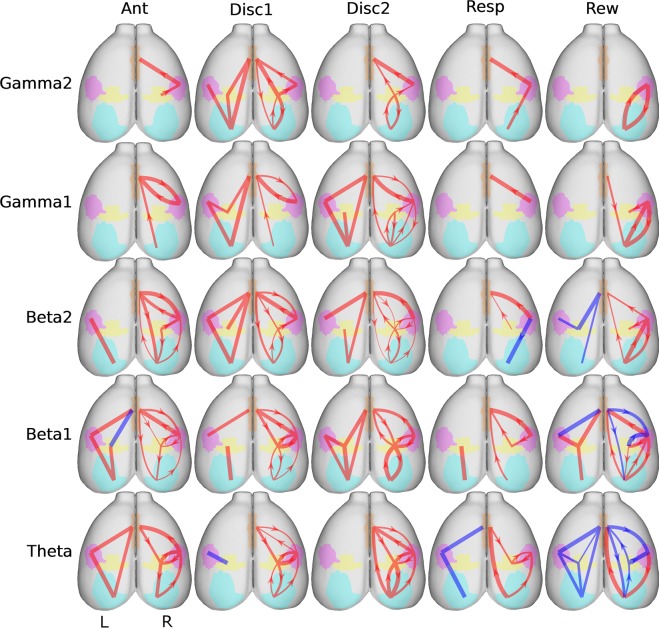
Processing of tactile sensory information in rodents is critically dependent on the communication between the primary somatosensory cortex (S1) and higher-order integrative cortical areas. Here, we have simultaneously characterized single-unit activity and local field potential (LFP) dynamics in the S1, primary visual cortex (V1), anterior cingulate cortex (ACC), posterior parietal cortex (PPC), while freely moving rats performed an active tactile discrimination task. Simultaneous single unit recordings from all these cortical regions revealed statistically significant neuronal firing rate modulations during all task phases (anticipatory, discrimination, response, and reward). Meanwhile, phase analysis of pairwise LFP recordings revealed the occurrence of long-range synchronization across the sampled fronto-parieto-occipital cortical areas during tactile sampling. Causal analysis of the same pairwise recorded LFPs demonstrated the occurrence of complex dynamic interactions between cortical areas throughout the fronto-parietal-occipital loop. These interactions changed significantly between cortical regions as a function of frequencies (i.e. beta, theta and gamma) and according to the different phases of the behavioral task. Overall, these findings indicate that active tactile discrimination by rats is characterized by much more widespread and dynamic complex interactions within the fronto-parieto-occipital cortex than previously anticipated.


Conflict of interest statement

The authors declare no competing interests.

Figures

Figure 1
Figure 1
Experimental design of the tactile discrimination task and recorded cortical areas. (A) Schematic representation of the behavioral apparatus. Briefly, the apparatus consists of a box with two compartments: discrimination and reward chambers separated by sliding door. The discrimination chamber contains a variable width aperture (wide or narrow) and a central nose poke. The other compartment, reward chamber, contains two reward ports (left and right). The behavioral task was divided in phases according to the animal’s behavior and it localization in relation to the box [anticipatory: −1.0 to −0.4 s (green), discrimination 1: −0.4 to 0 s (light blue), discrimination 2: 0 to 0.4 s (dark blue), response: 0.4 to 2.0 s (red) and reward: 2.0 to 4.0 s (yellow)]. The instant t = 0 s is defined as the moment that the animal reaches the central nose poke, and thus, experience the maximum vibrissae deflection. (B) The rats were trained to discriminate between a narrow (52 mm) versus wide (85 mm) aperture using only their mystical vibrissae to receive a water reward in the left or right rewards, respectively. (C) Unit activity and local field potential were recorded from four cortical regions (anterior cingulate cortex [ACC], posterior parietal cortex [PCC], primary somatosensory cortex [S1] and visual cortex [V1]) during the active tactile discrimination task.
Figure 2
Figure 2
Single peri-event histogram recorded during active tactile discrimination task in the ACC, PPC, S1 and V1. Periods of increase and decrease in neuronal activity occurred during all task stages [anticipatory (green 1), discrimination 1 (light blue 2), discrimination 2 (dark blue 3), response (red 4) and reward (yellow 5) in all recorded cortical areas. The instant t = 0 s is defined as the moment that the animal reaches the central nose poke. Solid pink bar along the x-axis indicates baseline period. Increase and decrease of statistically significant neuronal activity are indicated by red and blue lines, respectively. Examples trace showing raw LFP of each brain region are shown in blue superimposed each raster plot. Black vertical bars next to each LFP indicate the 0.2 mV scale.
Figure 3
Figure 3
Representation of neuronal activity recorded simultaneously across the frontal-parietal-occipital cortex during execution of an active tactile discrimination task. Each figure shows the peristimulus time histograms (PSTH) from all neurons recorded in different structures. From left to right: ACC (164 units), PPC (165 units), S1 (142 units), and V1 (202 units). Each row in each figure represents the activity of a neuron normalized to its average firing rate during the baseline period ([−3, −1] s). Each color represents a variation in the firing rate. Increase is in red; decrease is in deep blue. Units were ordered by the average firing rate in −1.5 to −0.5 s. The dotted white vertical line marks the center nose poke (CNP) task period (Time 0). There were neurons with increased firing rate immediately before the whiskers contacted with CNP in all recorded regions. The vertical black dashed lines divide the figures in the task periods: anticipatory: −1.0 to −0.4 s (green 1), discrimination 1: −0.4 to 0 s (light blue 2), discrimination 2: 0 to 0.4 s (dark blue 3), response: 0.4 to 2 s (red 4) and reward: 2 to 4 s (yellow 5).
Figure 4
Figure 4
Phase synchronization increases during whisker discrimination task in theta (4–12 Hz), beta 1 (13–21 Hz), beta 2 (22–30 Hz), gamma 1 (31–65 Hz) and gamma 2 (66 to 100 Hz) frequency bands. (A) Average time-frequency charts of the phase synchronization changes obtained during the task, for each pair of recorded regions (ACC – PPC; ACC – S1; ACC – V1; PPC – S1; PPC – V1 and S1 – V1). Each chart represents the z-score (to the respective [−3 −1] baseline period) average phase synchronization across all pairs of electrodes and subjects. The dotted white vertical line marks the CNP task period. The vertical black dashed lines divide the figures in the task periods. The following behavioral epochs were defined: anticipatory from −1.0 to −0.4 s (green 1); discrimination 1 from −0.4 to 0 s (light blue 2); discrimination 2 from 0 to 0.4 s (dark blue 3); response from 0.4 to 2.0 s (red 4) and reward from 2.0 to 4.0 s (yellow 5). Major changes are observed in theta (4–12 Hz), beta (13–30 Hz), low gamma (30–70 Hz) and high gamma frequency bands (70–100 Hz). Note that there are specific time-frequency values where cortical regions become synchronized across the task. (B) Significance of phase locking value during each epoch of the tactile discrimination task. The plot with the red bar indicates significative PLV increase and blue bar indicates significative PLV decrease. Was considered as significant values those higher than baseline mean plus two times its standard deviation. (C) Left: Average gamma phase synchronization in a window of −0.5 to 0.5 s from 40 to 80 Hz for all pairs of regions recorded in this study. The dotted red curve represents the instant of maximum phase synchronization for each frequency. Centre: same as before, but frequency Z-scored. Right: pairwise maximum frequency z-scored. Linear fit is related to the average curve of the maximum PLV. The angular coefficient of the linear regression was −96. In other words, at every 0.01 s peak PLV was observed 1 Hz down from the current frequency value.
Figure 5
Figure 5
Grid of spectral Granger causality maps in the frontal-parietal-occipital loop. The colormap is presented in baseline standard deviation units (how many times a GC is greater or lesser than the baseline standard deviation). The lines in figure grid represent the cortical structures were the information was originated, while the columns represent the target structures (GC direction is defined from the structure that originates the information to target structure). The instant t = 0 s (dashed white line) is defined as the instant that the animal reaches the central nose poke, and thus, experience the maximum vibrissae deflection. The vertical black dashed lines divide the figures in the task periods (anticipatory – green 1, discrimination 1 – light blue 2, discrimination 2 – dark blue 3, response – red 4 and reward – yellow 5), and the horizontal lines divide the figure in frequency bands (theta 4–12 Hz, beta 1 [13–21 Hz], beta 2 [22–30 Hz], gamma 1 [31–65 Hz] and gamma 2 [66 to 100 Hz]). Absolute GC variations from the baseline, higher than two times the baseline standard deviation, were considered significant. The figures in the grid diagonal show the significant regions of the spectral GC maps. Each diagonal figure brings information about the three other GC maps at the same line. The colored regions indicate the significant map regions, where red represents the first map that appears in that line grid (left to right), green the second and blue the third. If a region was significant in more than one map, the color of the maps should be overlayed (maps 1 and 2 = yellow; maps 1 and 3 = magenta; maps 2 and 3 = cyan; maps 1, 2 and 3 = white). The maps reveal both top-down and bottom-up directed influence, which was stronger and time-frequency specific during active tactile discrimination task. Spectral GC values were estimated with a 150 ms window running in 10 ms time steps.
Figure 6
Figure 6
Summary of granger causality findings supporting distributed processing during an active tactile discrimination task. The left hemisphere represents the PLV findings (L) while the right hemisphere represents the GC results (R). The PLV was represented in the left hemisphere as didactic resource. Note that both phase lock and Granger causality analysis are the result of recordings performed on the right hemisphere. The thickness of the edges indicates the strength of the synchrony (PLV) and information flow or G-connectivity (GC) between the structures. The red edges indicate a rise while the blue edges indicate a decrease in synchrony or G-connectivity between the brain structures. In the GC graphs (right hemisphere), the arrows indicate the direction of the information flow. The ACC is represented by the orange region, PPC yellow, S1 pink, and V1 light blue. The graphs suggest that both primary sensory areas and higher order areas can drive responses depending on the animal behavior.

Similar articles

Cited by

References

    1. Woolsey TA, Van Der Loos H. The structural organization of layer IV in the somatosensory region (SI) of mouse cerebral cortex. The description of a cortical field composed of discrete cytoarchitectonic units. Brain Res. 1970;17:205–242. - PubMed
    1. Welker C. Receptive fields of barrels in the somatosensory neocortex of the rat. J. Comp. Neurol. 1976;166:173–189. - PubMed
    1. Bedwell SA, Billett EE, Crofts JJ, Tinsley CJ. The topology of connections between rat prefrontal, motor and sensory cortices. Front. Syst. Neurosci. 2014;8:1–10. - PMC - PubMed
    1. Romanski, L. Convergence of Auditory, Visual, and Somatosensory Information in Ventral Prefrontal Cortex. in The Neural Bases of Multisensory Processes. (eds Murray, M. M. & Wallace, M. T.) (CRC Press/Taylor & Francis, 2012). - PubMed
    1. Pais-Vieira M, Lebedev M, Wiest M, Nicolelis M. Simultaneous Top-down Modulation of the Primary Somatosensory Cortex and Thalamic Nuclei during Active Tactile Discrimination. J. Neurosci. 2013;33:4076–4093. - PMC - PubMed

Publication types