. 2019 Apr;3(4):570-576.
doi: 10.1038/s41559-019-0847-9. Epub 2019 Mar 25.

Epistatic mutations under divergent selection govern phenotypic variation in the crow hybrid zone

Affiliations

Epistatic mutations under divergent selection govern phenotypic variation in the crow hybrid zone

Ulrich Knief et al. Nat Ecol Evol. 2019 Apr.

Abstract

The evolution of genetic barriers opposing interspecific gene flow is key to the origin of new species. Drawing from information on over 400 admixed genomes sourced from replicate transects across the European hybrid zone between all-black carrion crows and grey-coated hooded crows, we decipher the interplay between phenotypic divergence and selection at the molecular level. Over 68% of plumage variation was explained by epistasis between the gene NDP and a ~2.8-megabase region on chromosome 18 with suppressed recombination. Both pigmentation loci showed evidence for divergent selection resisting introgression. This study reveals how few, large-effect loci can govern prezygotic isolation and shield phenotypic divergence from gene flow.


Conflict of interest statement

Competing interests

The authors declare no competing interests.

Figures
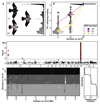
Figure 1
Figure 1. Genetic basis of phenotypic variation.
(a) Examples of pure parental (CC: carrion crow, HC: hooded crow) and hybrid (Fx) phenotypes. Plumage pigmentation was scored on a grey scale for dorsal (D) and ventral (V) patches and subsequently summarized by principal component analysis. The abscissa shows the smoothed density distribution of PC1 scores for 122 individuals with the underlying shading for orientation. (b) Manhattan plot of genome-wide association analysis for PC1 scores shown for 1103 SNPs by chromosome. Significantly associated SNPs are shown in red. The dashed line represents the genome-wide significance threshold. (c) Left: Close-up of the 74 most ancestry informative SNPs within the FST outlier region of chromosome 18 (chr18). SNPs are coloured by ancestry of the parental populations (black: carrion crow, light grey: hooded crow, dark grey: heterospecific). Right: Ancestry components inferred across all SNPs group individuals into three discrete classes corresponding to the three diplotypes: chr18DD, chr18DL, chr18LL. (d) Decomposition of phenotypic variation as predicted by the recessive, epistatic interaction between the gene NDP and chr18 ancestry type. Alleles are named by their inferred phenotypic effect (D: dark, L: light).
Figure 2
Figure 2. Cline analysis.
Left: Geographic clines for hybrid indices estimated from genome-wide data (a, e, N = 752 SNPs) and SNPs on chromosome 18 (b, f, N = 230 SNPs). Estimates are shown for both the central hybrid zone (a, b, N = 116 individuals) and the southern hybrid zone (e, f, N = 273 individuals). Depicted are the maximum-likelihood clines and observed average hybrid indices per sample location (with the 95% credible cline region shaded in grey). Each cline extends from the allopatric carrion to the allopatric hooded crow populations. Circle areas reflect sample sizes, colours are used for orientation (dark grey: carrion crow, light grey: hooded crow). The abscissa is centered on the cline centre, rectangles (yellow: central, red: south) depict the cline widths predicted by the models. Right: Summary statistics of genomic cline analyses shown for all 1111 SNPs across the genome (left c, g) and for the outlier region of chromosome 18 (chr18) specifically (right d, h). Depicted is the -log10(P-value) of the cline rate v with high values reflecting departures of introgression from the genome average. SNPs with the strongest evidence (upper 5 percentiles) for reduced introgression are coloured (yellow: central, red: south). The dashed lines in (g) and (h) represent the genome-wide significance threshold.

References

    1. Wolf JBW, Ellegren H. Making sense of genomic islands of differentiation in light of speciation. Nat Rev Genet. 2017;18:87–100. doi: 10.1038/nrg.2016.133. - DOI - PubMed
    1. Ravinet M, et al. Interpreting the genomic landscape of speciation: a road map for finding barriers to gene flow. J Evol Biol. 2017;30:1450–1477. doi: 10.1111/jeb.13047. - DOI - PubMed
    1. Vijay N, et al. Evolution of heterogeneous genome differentiation across multiple contact zones in a crow species complex. Nat Commun. 2016;7:e13195. doi: 10.1038/ncomms13195. - DOI - PMC - PubMed
    1. Mayr E. Systematics and the origin of species. Columbia University Press; 1942.
    1. Randler C. Assortative mating of carrion Corvus corone and hooded crows C. cornix in the hybrid zone in eastern Germany. Ardea. 2007;95:143–149. doi: 10.5253/078.095.0116. - DOI

Publication types