. 2019 Apr;568(7751):235-239.
doi: 10.1038/s41586-019-1049-y. Epub 2019 Mar 25.

Transcriptome-scale super-resolved imaging in tissues by RNA seqFISH

Affiliations

Transcriptome-scale super-resolved imaging in tissues by RNA seqFISH

Chee-Huat Linus Eng et al. Nature. 2019 Apr.

Abstract

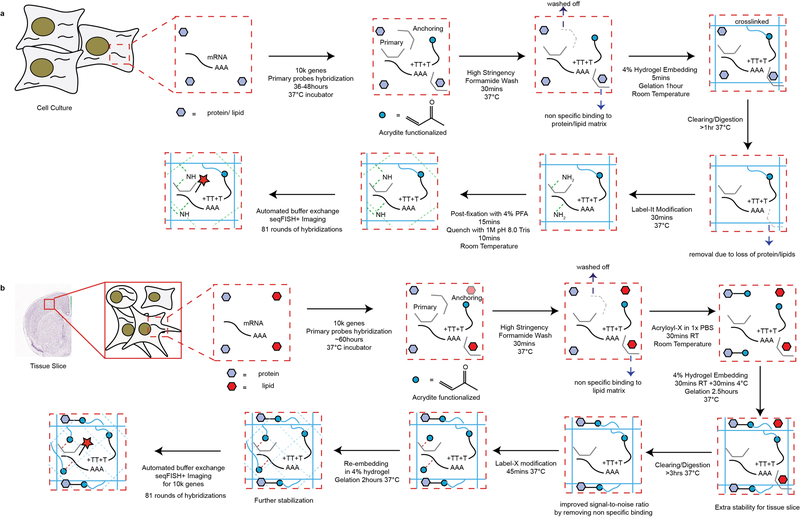
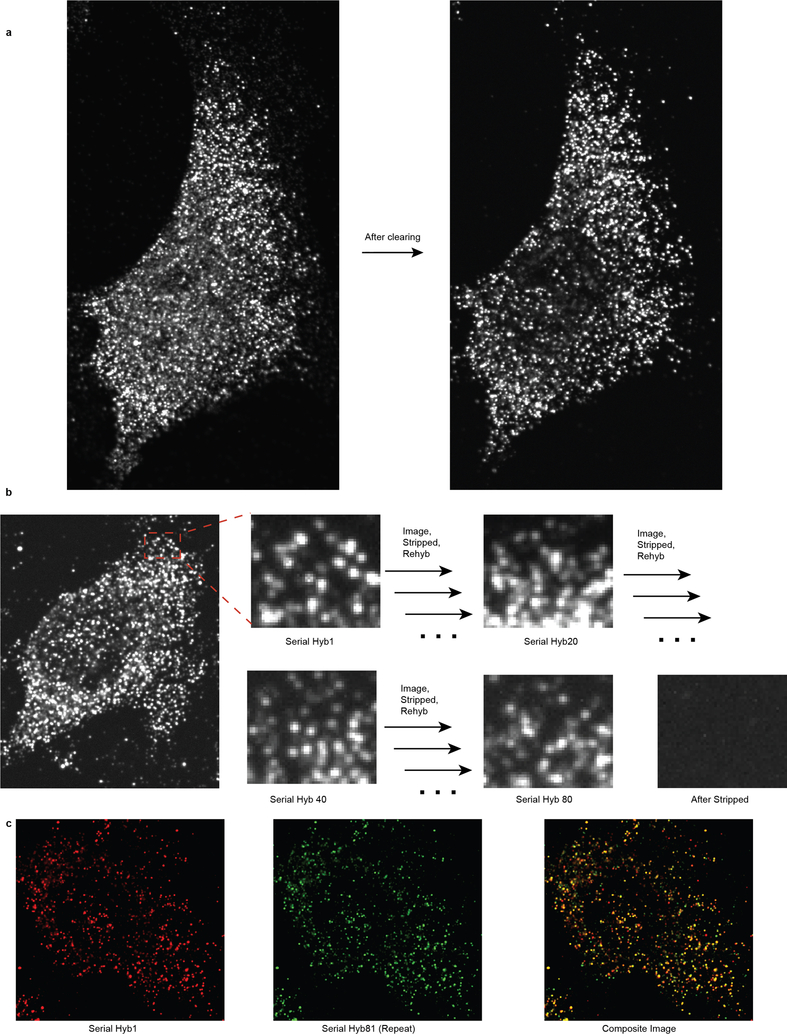
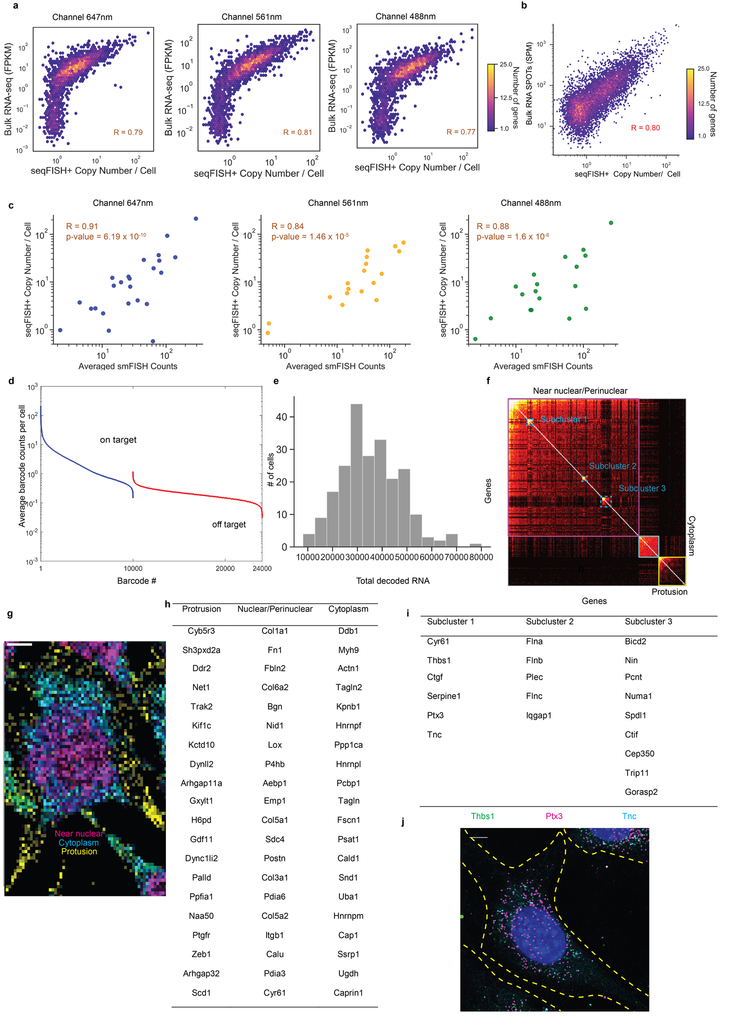
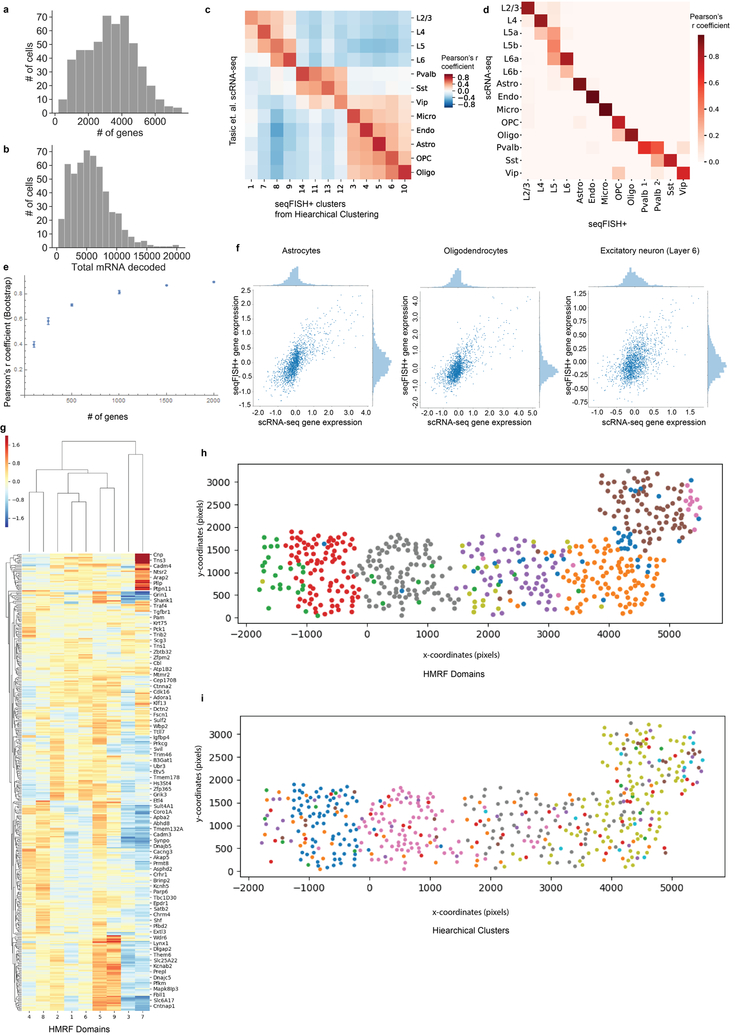
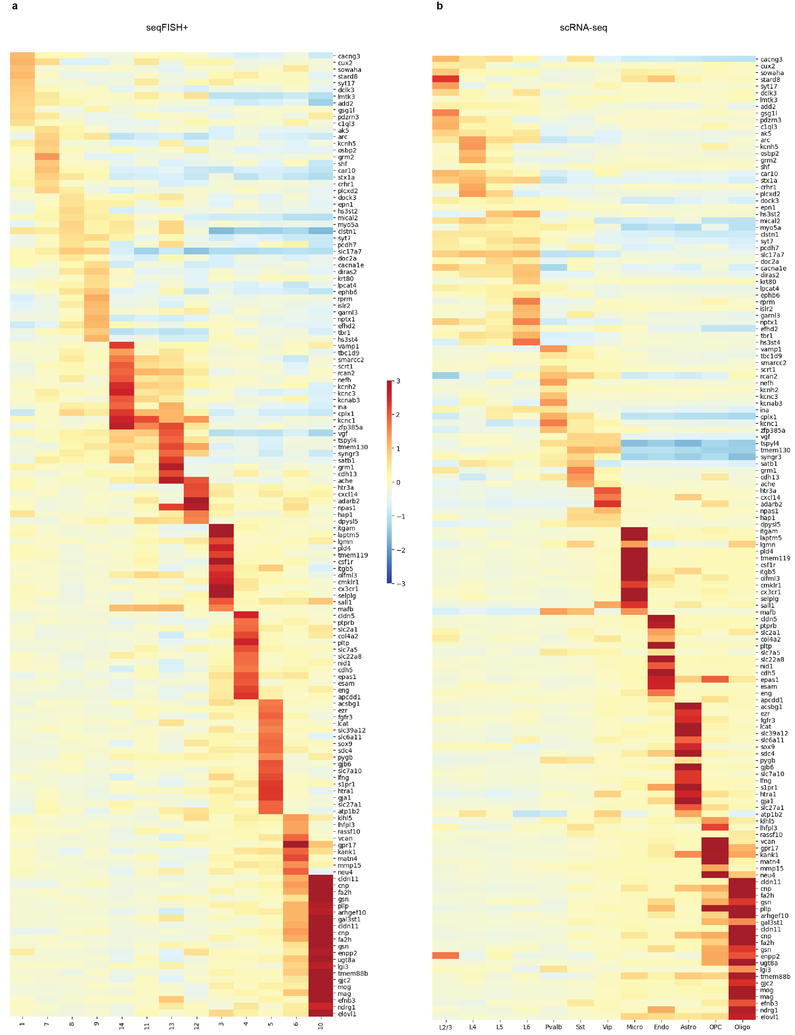
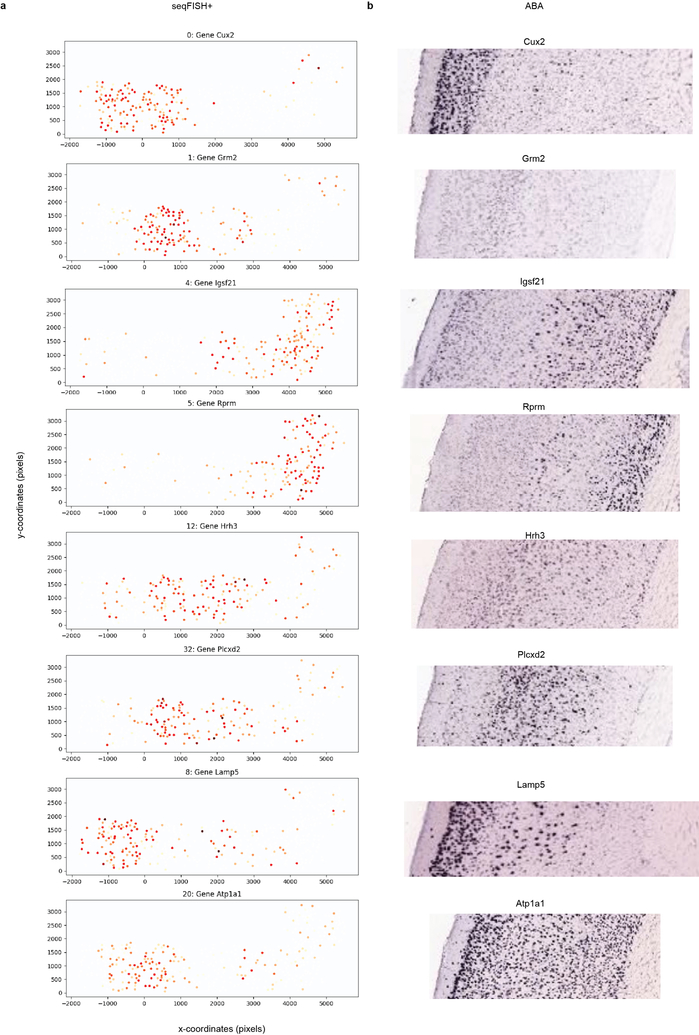
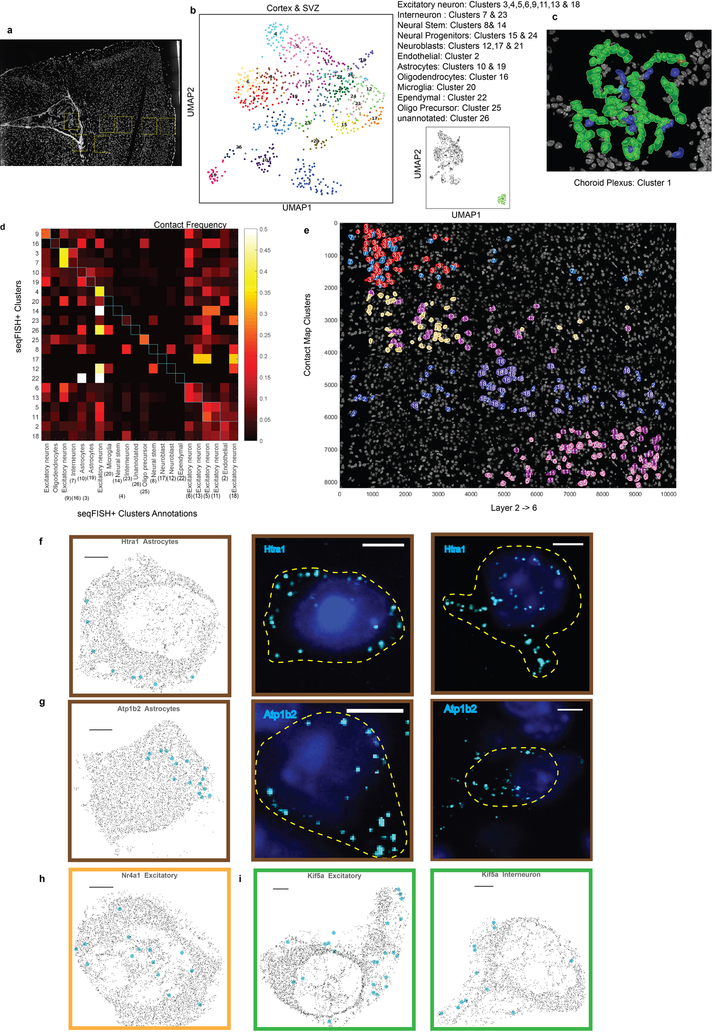
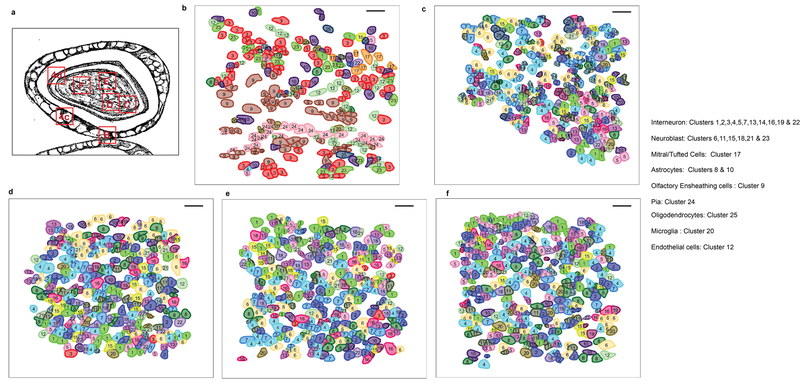
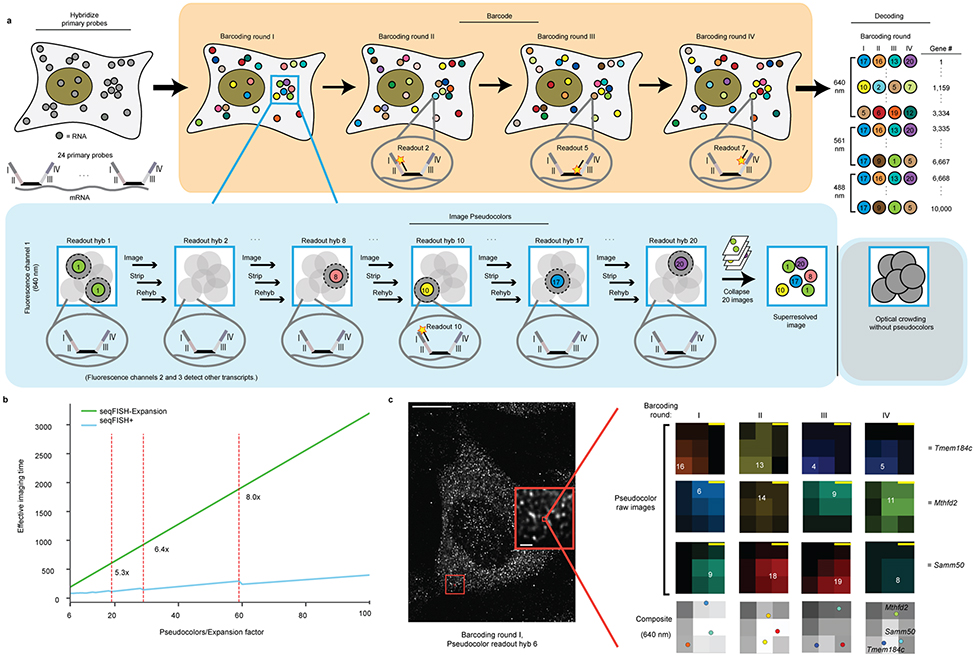
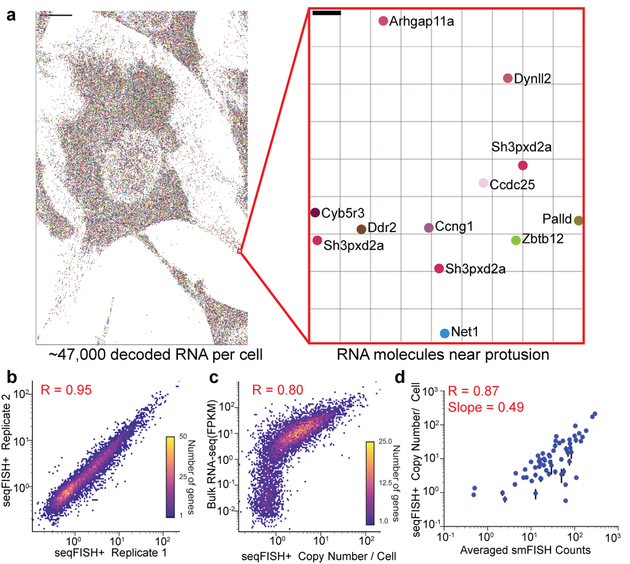
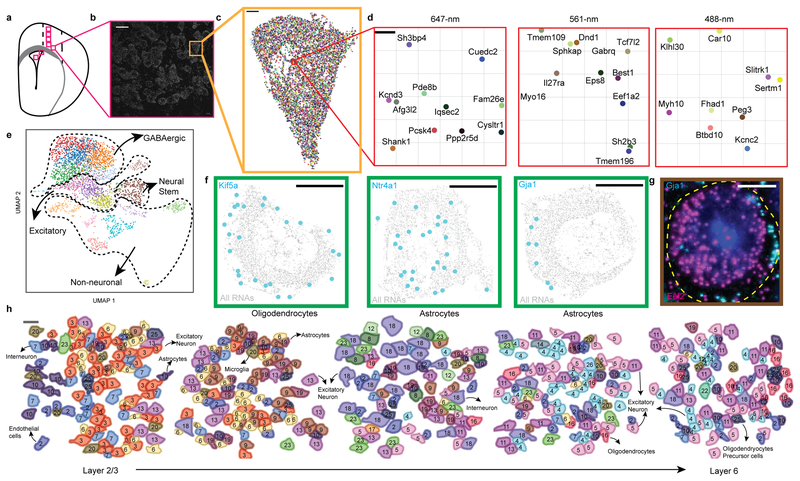
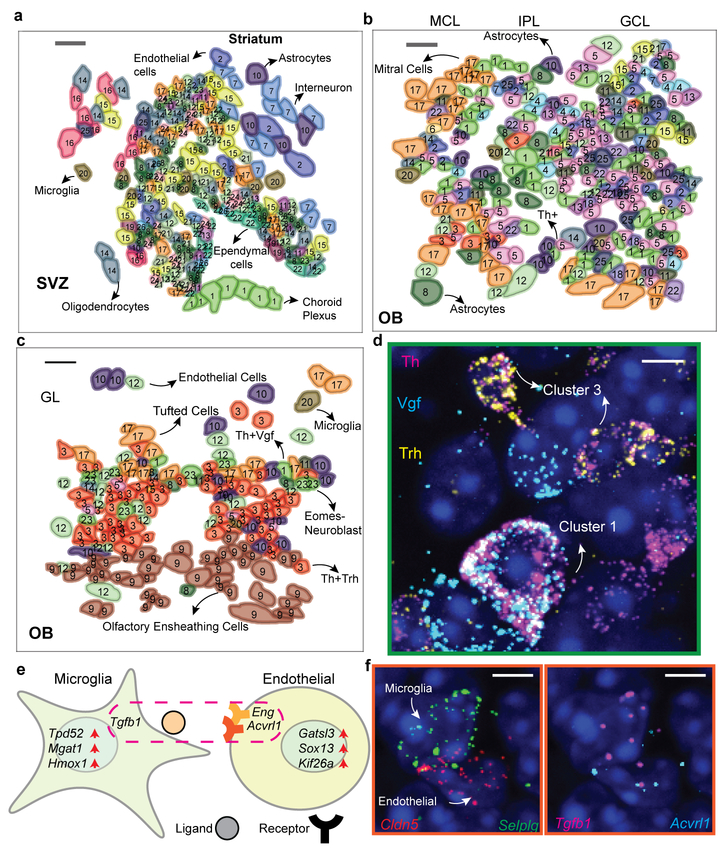
Imaging the transcriptome in situ with high accuracy has been a major challenge in single-cell biology, which is particularly hindered by the limits of optical resolution and the density of transcripts in single cells1-5. Here we demonstrate an evolution of sequential fluorescence in situ hybridization (seqFISH+). We show that seqFISH+ can image mRNAs for 10,000 genes in single cells-with high accuracy and sub-diffraction-limit resolution-in the cortex, subventricular zone and olfactory bulb of mouse brain, using a standard confocal microscope. The transcriptome-level profiling of seqFISH+ allows unbiased identification of cell classes and their spatial organization in tissues. In addition, seqFISH+ reveals subcellular mRNA localization patterns in cells and ligand-receptor pairs across neighbouring cells. This technology demonstrates the ability to generate spatial cell atlases and to perform discovery-driven studies of biological processes in situ.


Conflict of interest statement

Competing Interest:

C.-H.L.E and L.C. filed a patent on the pseudocolor encoding scheme in seqFISH+.

Figures

Extended Data Figure 1.
Clearing and probe anchoring protocols for the seqFISH+ experiments in (a) NIH3T3 cells and (b) the mouse brain slices.
Extended Data Figure 2.
Clearing removes background nonspecific bound dots. a, Raw images of a NIH3T3 cell before and after clearing. Significant decrease in background is observed in cleared sample. Image is acquired on a spinning disk confocal microscope. b, In each round of hybridization for the 10,000 gene experiment, diffraction limited dots are clearly separated, indicating the pseudocolor scheme effectively dilutes the density of the sample. Signal is completely removed between different rounds of hybridization, with no “cross-talk” between the pseudocolors. Stripping is accomplished by 55% formamide wash, which is highly efficient. c, After the completion of each seqFISH+ experiment, readout probes used in hyb1 is re-hybridized in round 81. The colocalization rates between Hyb1 and 81 are 76% (647 channel), 73% (561 channel) and 80% (488 channel) within a 2 pixel radius. The colocalization between the two images indicates that most of the primary probes remain bound through 80 rounds of hybridization and imaging, although some loss of RNA and signal is seen across 80 rounds of hybridization (a-c, n = 227 cells).
Extended Data Figure 3.
seqFISH+ works efficiently across all three fluorescent channels and identifies localization patterns of transcripts in NIH3T3 cells. a, Correlation plots between seqFISH+ and bulk RNAseq in three fluorescent channels. Barcodes are coded entirely within each channel, with n = 3334, 3333, and 3333 barcodes in each channel respectively. Barcodes in all channels are decoded and called out efficiently. b, seqFISH+ result correlates strongly with RNA SPOTs measurement in NIH3T3 cells. SPM= Spots Per Million. c, Correlation between seqFISH+ and smFISH for each fluorescent channel (from left to right: n = 24, 18, 18 genes). All correlations were computed by Pearson’s r coefficient correlation with two-tailed p values reported. d, The callout frequency of on-target 10,000 barcodes versus the remaining 14,000 off target barcodes. Off target barcodes are called out at a rate of 0.22±0.07 (mean±s.d) per barcode. e, Histogram of the total number of mRNAs detected per NIH3T3 cell. On average, 35,492±12,222 transcripts are detected per cell. f, Genes are clustered based on their co-occurrence in 10×10 pixel window. Three major clusters are nuclear/perinuclear, cytoplasmic and protrusions. g, mRNAs show preferential spatial localization patterns: nuclear, cytoplasm and protrusion (n = 227 cells). The image is binned into 1 μm × 1 μm windows and colored based on the genes enriched in each bin (scale bar = 10 μm). h, Example of genes enriched in each spatial cluster. i, Genes in the subclusters within the nuclear localized group. Subcluster 1 contains genes encode for extracellular matrix proteins. Subcluster 2 genes are involved in actin cytoskeleton while subcluster 3 genes are involved in microtubule networks. j, Representative smFISH image (single z-slice) of three genes in subcluster 1 shows nuclear/perinuclear localization (n = 20 FOVs, 40x objective). Scale bar: 10μm.
Extended Data Figure 4.
scRNAseq comparison with seqFISH+, bootstrap and HMRF analysis. a, Histogram of the number of genes and b, total RNA barcodes detected per cell by seqFISH+ in the cortex. c, Unsupervised clustering of seqFISH+ correlates well with scRNAseq. (n = 1857 genes; Pearson’s r coefficient correlation) d, Supervised mapping of seqFISH+ analyzed cortex cell clusters with those from single cell RNA-seq clusters. (n = 1253 genes; p-value < 0.005). e, The number of genes were downsampled from the 2511 genes that expressed at least 5 copies in a cell. For each downsampled dataset, the cell-to-cell correlation matrix is calculated and correlated with the cell-to-cell correlation matrix for the 2511 gene dataset. 5 trials are simulated for each downsampled gene level. Error bars denote mean +/− standard deviation. Even when downsampled to 100 genes, about 40% of the cell to cell correlation is retained, because the expression pattern of many genes are correlated. f, Scatterplots of seqFISH+ with scRNAseq in different cell types. Each dot represents a gene and their mean expression z-score values in either seqFISH+ or scRNAseq in astrocytes, oligodendrocytes and excitatory neurons. In general, seqFISH+ and scRNAseq are in good agreement (n = 598 genes each). g, HMRF detects spatial domains that contain cells with similar expression patterns regardless of cell type. Domain specific genes are shown. h, Spatial domains in the cortex. i, Mapping of the hierarchical clusters onto the cortex. X-Y coordinates are in pixels (103 nm per pixel). Each camera field of view is 2000 pixels.
Extended Data Figure 5.
Differential gene expressions between the cell type clusters in both (a) seqFISH+ and (b) scRNA-seq. The expression patterns of seqFISH+ clusters are similar with scRNA-seq clusters (n = 143 genes)
Extended Data Figure 6.
Comparison of the spatial expression patterns across the cortex in the (a) seqFISH+ data versus the (b) Allen Brain Atlas. X-Y coordinates are in pixels (103 nm per pixel). Layers I-VI are shown from left to right.
Extended Data Figure 7.
Additional analysis of cortex and subcellular localization patterns in different cell types. a, Slide explorer image of the cortex and SVZ FOVs imaged in the first brain slice (n=913 cells). Schematic is shown in Fig 3a. b, UMAP representation of cortex and SVZ cells. c, Mapping of the choroid plexus cells, which are exclusively present in the ventricle (n =109 cells). d, Frequency of contacts between the different cell class in the cortex, normalized for the abundances of cells in each clusters. e, Each strip represents cells that cluster together, which breaks into layers in the cortex, consistent with expectation, as cells within a layer preferential interact with each other (n = 523 cells). f, Htra1 transcripts are preferentially localized to the periphery of the astrocytes in the cortex. Left panel shows a reconstructed image from the 10,000 gene seqFISH+ experiment. Htra1 transcripts are shown in cyan, and all other transcripts are shown in black. Scale bar is 2μm. Middle and right panels show single z-slice of smFISH images of Htra1 in cortical astrocytes (Scale bar: 5μm). g, Atp1b2 localization in seqFISH+ (left; scale bar: 2μm) and single z-slice smFISH images (middle and right; scale bars: 5μm). Many Htra1 and Atp1b2 transcripts are localized to astrocytic processes (f,g, n= 62 astrocytes). SmFISH images were background subtracted for better display of RNA molecules (n= 10 FOVs, 40x objective). h, Nr4a1 localization patterns are distinct from Htra1 and Atp1b2 and are more nuclear localized across different cell types. An excitatory neuron is shown from the seqFISH+ reconstructions (n = 337 excitatory neurons; scale bars: 2μm). i, Kif5a, a kinesin, also exhibits periphery and process localizations in different cell types (n = 60 interneurons; scale bar: 2μm).
Extended Data Figure 8.
Additional analysis of the subventricular zone (SVZ). a, Expression of individual genes in the SVZ in the UMAP representation (n = 281 cells). b, Violin plots denotes z-scored gene expression patterns for Louvain clusters corresponding to NSC to neuroblasts in the SVZ, (n = 281 cells). c, Spatial proximity analysis of the cell clusters in the mouse subventricular zone(SVZ). Frequency of contacts between the different cell class in the SVZ, normalized for the abundances of cells in each clusters. d, Neural progenitors appear to be in spatial proximity with each other. e, Two neuroblasts cell clusters are found to be in spatial proximity in the SVZ (c-d, n = 281 cells). f, Subclusters of type 7 cells in the cortex (left). Medium spiny neurons that expressed Adora2, Pde10a, and Rasd2 marker genes form a separate cluster that are detected only in the striatum (right) (n = 42 cells in cluster 7).
Extended Data Figure 9.
Additional analysis of the olfactory bulb (OB). a, Slide explorer image of the OB FOVs imaged in the second brain slice. b, UMAP analysis of OB cells. c, Z-scored gene expression patterns heatmap of cells in the olfactory bulb. d, Violin plots show z-scored marker genes expression patterns in the different classes of cells detected in the OB. (a-d, n = 2050 cells) e, Representative smFISH images of Th and Trh. Images were maximum z-projected. In the glomeruli layer (GL), cluster 3 cells express both Th and Trh, whereas in the GCL, only Th are expressed (cluster 5 and 22 cells). (n= 10 FOVs, 40x objective). Scale bars: 13μm (left image); 6.5μm (right image). f, Frequency of contacts between the different cell class in the glomerulus, normalized for the abundances of cells in each cluster. g, Cell clusters #3 (Th+ interneurons) and #23 (neuroblast) are in close proximity in the mapped image (f-g, scale bars: 20μm).
Extended Data Figure 10.
Spatial organization of the olfactory bulb. a, Schematics of the field of views imaged in the OB. Spatial mapping of the cell clusters in the Glomerulus Layer (b) and Granule Cell Layer (c-f) in the OB. Note the neuroblast cells tend to reside in the interior of the GCL (upper parts of c and d and lower parts of e and f), whereas more mature interneurons are present in the outer layer. This is consistent with the migration of neuroblasts from the SVZ through the rostral migratory stream into the granule cell layer.Scale bars : 20μm.
Figure 1.
Figure 1.. seqFISH+ resolves optical crowding and enables transcriptome profiling in situ.
a, Schematics of seqFISH+. Primary probes (24 per gene) against 10,000 genes are hybridized in cells. Overhang sequences (I-IV) on the primary probes correspond to 4 barcoding rounds (orange panel). Only 1/20th of the total genes in each fluorescent channel are labeled by readout probes in each pseudocolor readout round, lowering the density of transcripts in each image. mRNA dots in each pseudocolor can then be localized by Gaussian fitting and collapsed into a super-resolved image (blue panel). Each gene is barcoded within only one fluorescent channel (Methods). b, Compared to seqFISH with expansion microscopy (seqFISH-Expansion, green line) in covering 24,000 genes, seqFISH+ with 60 pseudocolors (blue line) is 8 fold faster in imaging time. (Methods). c, Image of a NIH3T3 cell from one round of hybridization (n = 227 cells; scale bar = 10 μm). Zoomed in inset shows individual mRNAs (scale bar = 1 μm). Different mRNAs are decoded within a diffraction limited region, magnified from the inset (scale bar = 100 nm). The number in each panel corresponds to the pseudocolor round that each mRNA was detected, with no dots detected during the other pseudocolor rounds in this channel (640 nm).
Figure 2.
Figure 2.. seqFISH+ profiles 10,000 genes in cells with high efficiency.
a, Approximately 47,000 mRNAs (colored dots) were identified in a NIH3T3 cell from a single z-section (scale bar = 10 μm). Inset shows the transcripts decoded in cell protrusions (n = 227 cells; scale bar = 100 nm). b, seqFISH+ replicates in NIH3T3 cells are highly reproducible (n1 = 103 cells; n2 = 124 cells). seqFISH+ correlates well with (c) RNA-seq (n = 9875 genes) and (d) single molecule FISH (n= 60 genes; p-value = 2.26 × 10⁻¹⁹). The efficiency of seqFISH+ is about 49% compared to smFISH. Error bars in (d) represents standard error of the mean. (b-d, p-values < 0.0001, Pearson’s r, two-tailed p values).
Figure 3.
Figure 3.. seqFISH+ robustly characterize cell classes and subcellular RNA localization in brain slices.
a, Schematic of the regions (red boxes) imaged. b, Cells in a single FOV of the cortex (scale bar = 20 μm). c, Reconstruction of the 9,418 mRNAs (colored dots) detected in a cell (scale bar = 2 μm). d, Decoded transcripts for a magnified region (n= 523 cells, scale bar= 100nm). e, Uniform Manifold Approximation and Projection (UMAP) representation of the seqFISH+ data in the cortex, SVZ, and olfactory bulb (n=2963 cells). f, Reconstructed seqFISH+ images show subcellular localization patterns for mRNAs (Cyan) in different cell types. (n = 62 astrocytes and 28 oligodendrocytes; scale bar = 2 μm). g, smFISH of Gja1 in cortical astrocytes shows periphery localization compared to the uniform distribution of Eef2 mRNAs. (n=10 FOVs,40x objective;scale bar = 5μm). h. Each cortex layer consists of a distinct cell class composition (see annotations, Supplementary Table 2). (scale bar = 20 μm).
Figure 4.
Figure 4.. seqFISH+ reveals ligand receptor repertoires in neighboring cells and spatial organization in tissues.
a, Spatial organization of distinct cell clusters in the SVZ. b, Spatially-resolved cell cluster maps of the mitral cell layer(MCL), granule cell layer(GCL), and c, glomerular layer(GL) (scale bars: 20 μm). Remaining FOVs are shown in Extended Data Figure 10. The cluster numbers in the SVZ and OB are different (Supplementary Table 2). d, Distinct populations of Th+ dopaminergic neurons in the OB with differential expression of Vgf and Trh, shown with smFISH, confirming seqFISH+ clustering analysis. e, Schematic showing ligand-receptor pairs in neighboring microglia-endothelial cells. In microglia next to endothelial cells, certain genes, such as Tpd52, are enriched compared to microglia neighboring other cell types. f, mRNAs of Tgfb1 ligand and Acvrl1 receptor are visualized in adjacent microglia-endothelial cells by smFISH. (d&f, n = 10 FOVs, 40x objective; scale bars = 5 μm)

Comment in

References

    1. Lubeck E, Coskun AF, Zhiyentayev T, Ahmad M & Cai L Single-cell in situ RNA profiling by sequential hybridization. Nat. Methods 11, 360–361 (2014). - PMC - PubMed
    1. Chen KH, Boettiger AN, Moffitt JR, Wang S & Zhuang X Spatially resolved, highly multiplexed RNA profiling in single cells. Science 348, aaa6090 (2015). - PMC - PubMed
    1. Shah S, Lubeck E, Zhou W & Cai L In Situ Transcription Profiling of Single Cells Reveals Spatial Organization of Cells in the Mouse Hippocampus. Neuron 92, 342–357 (2016). - PMC - PubMed
    1. Lee JH et al. Highly multiplexed subcellular RNA sequencing in situ. Science 343, 1360–1363 (2014). - PMC - PubMed
    1. Wang X et al. Three-dimensional intact-tissue sequencing of single-cell transcriptional states. Science 361, (2018). - PMC - PubMed

Publication types